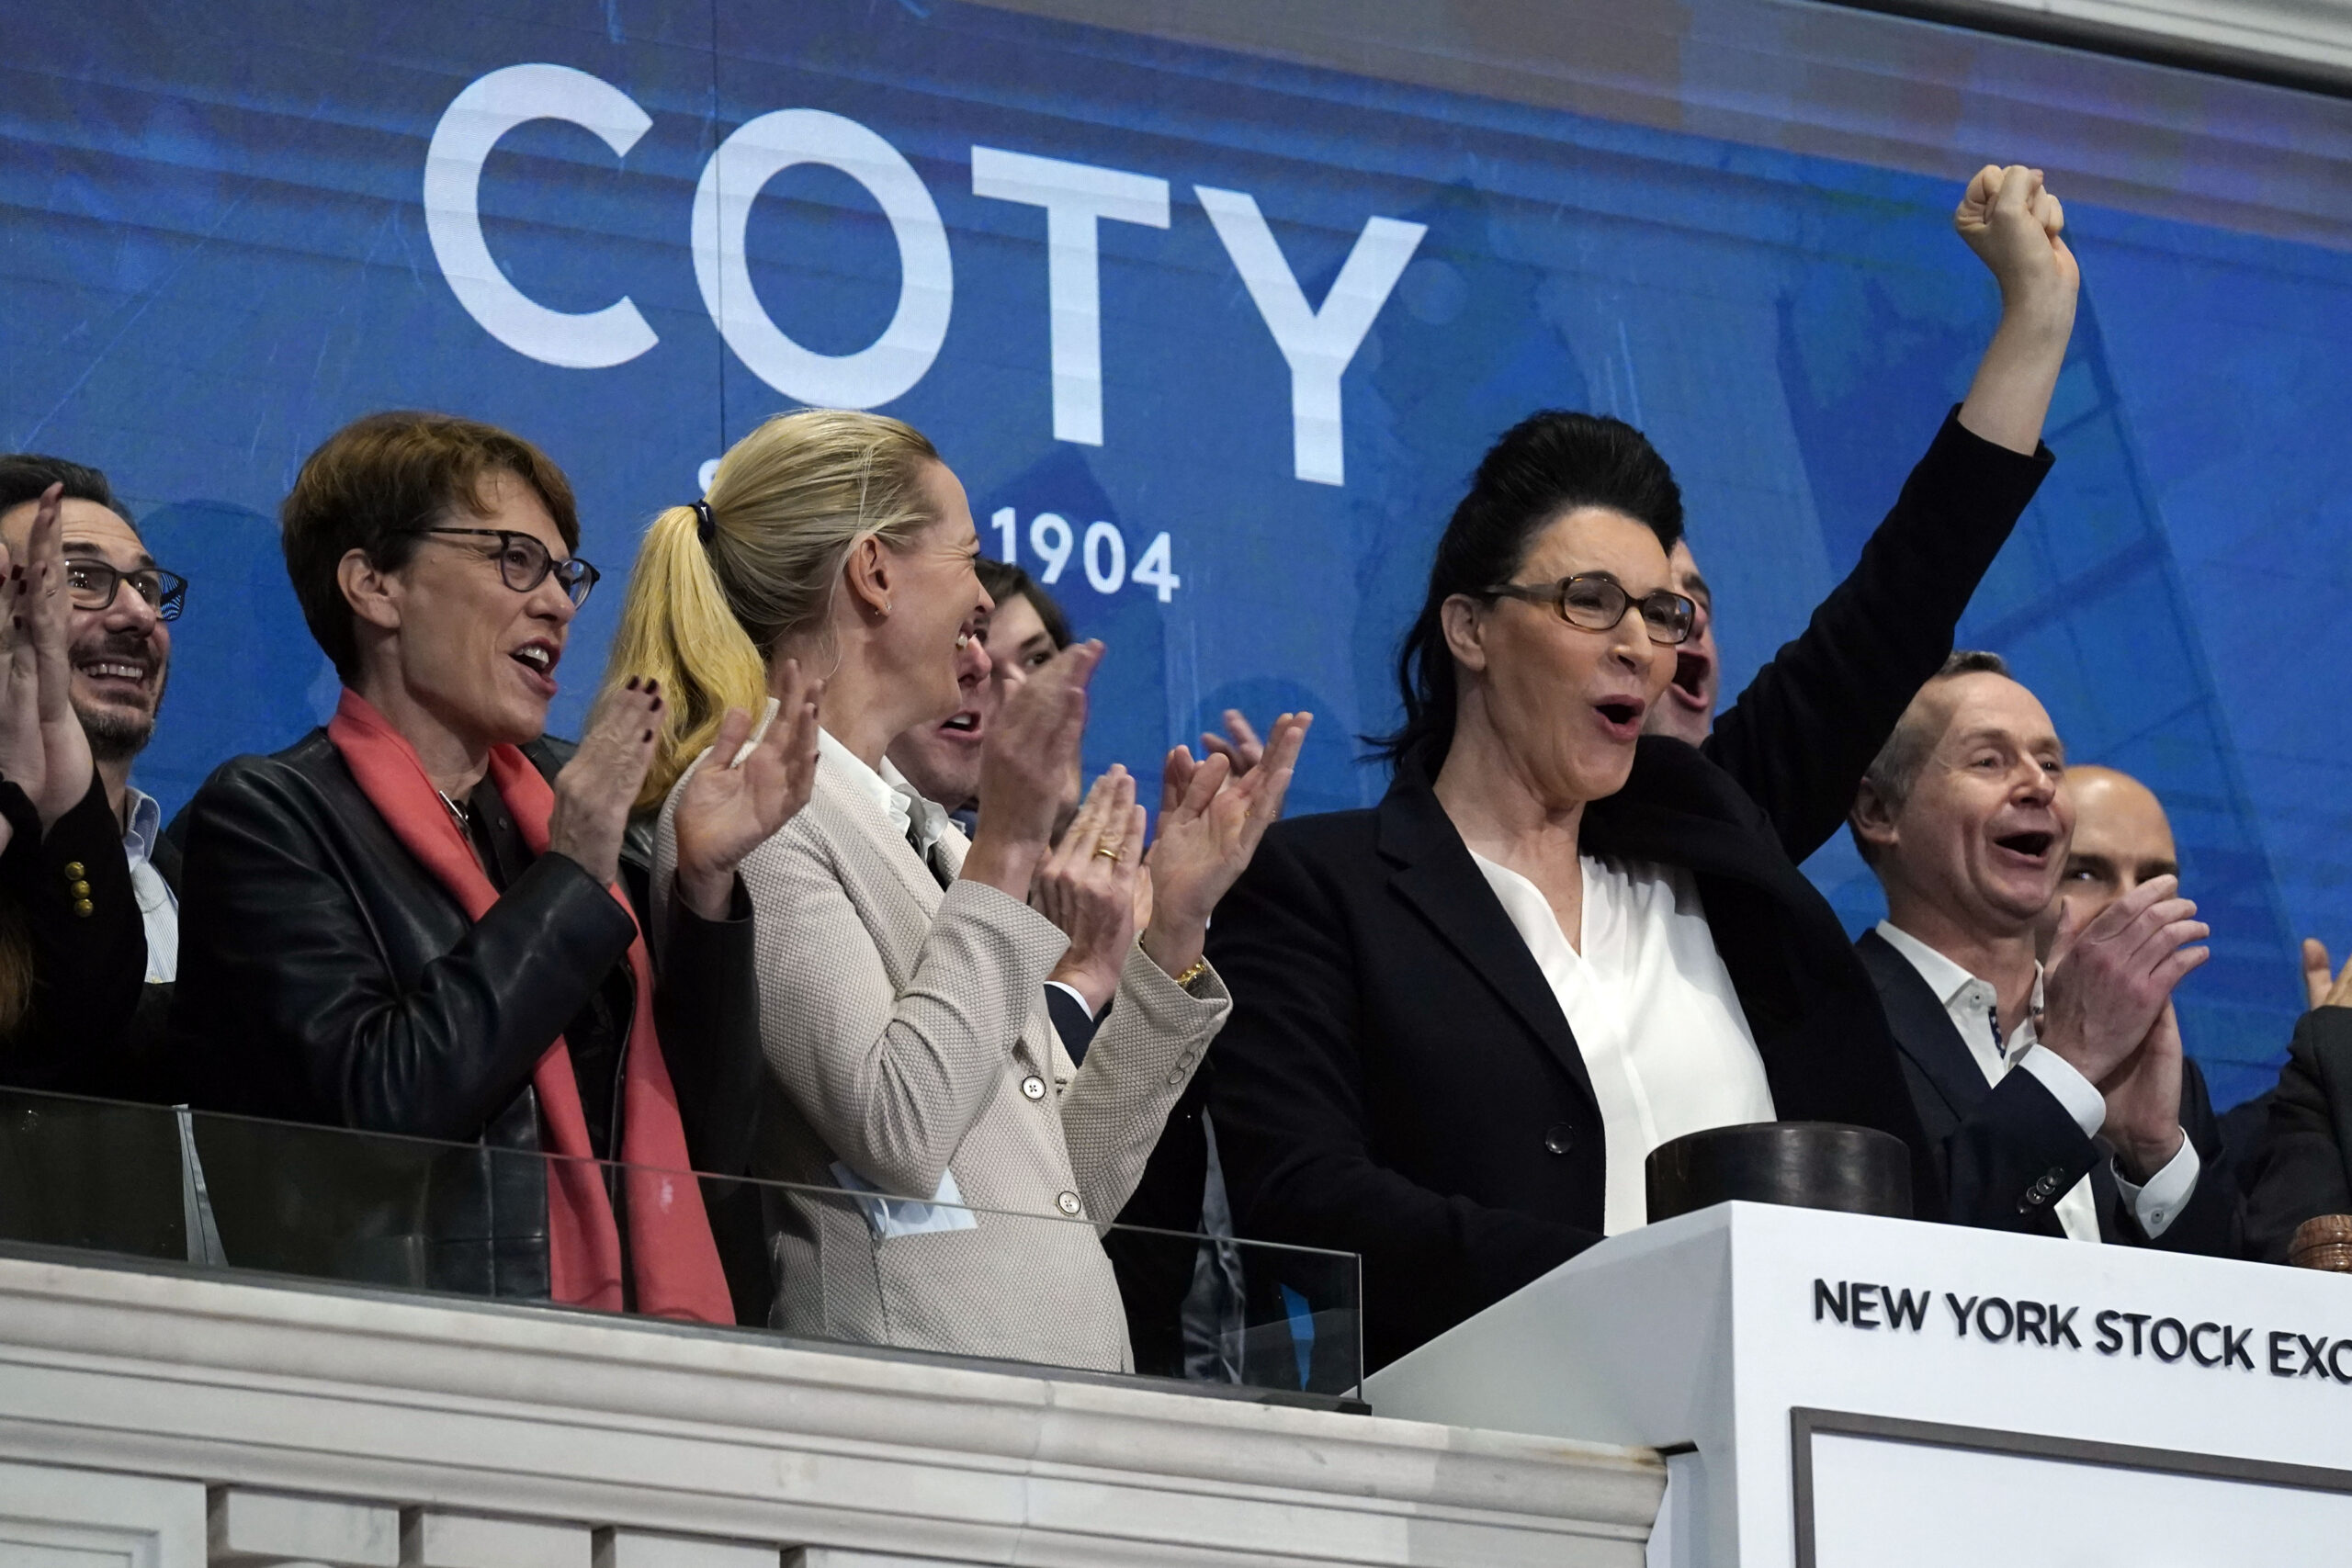
Image Credit: Associated Press
Coty (COTY) is one of the world’s largest beauty companies and owns some of the world’s most recognizable brands.
With great names like Vera Wang, Swarovski, Marc Jacobs, Calvin Klein, Lancaster, Gucci, and Burberry and a global footprint in a high-margin business… surely the stock has been a winner, right?
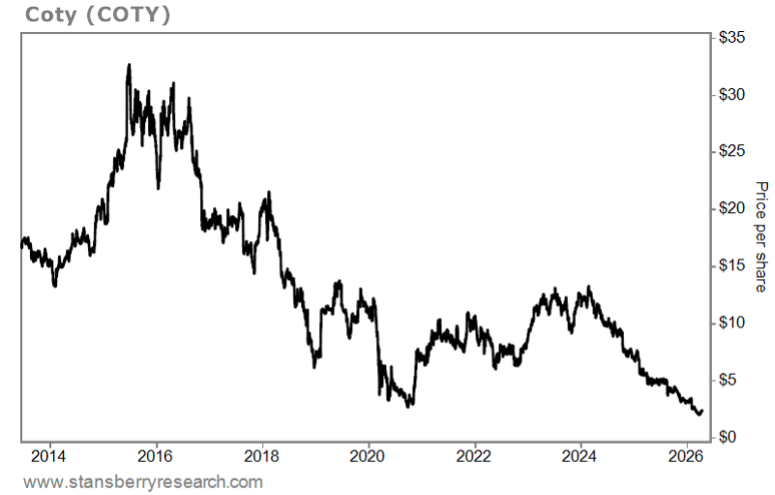
Wrong… It has been a dreadful value trap over the past 15-plus years. You don’t see stock charts this ugly very often:
The stock hit my radar when I read analyst Eden Bradfield’s recent Substack post about it.
He heard speculation that French fragrance company Interparfums (IPAR) is considering a bid for Coty’s perfume business. And as Coty’s debt continues to weigh on the company’s financials, management could be forced to sell, which could be at a price 70% above Coty’s current market capitalization.
So, let’s take a look at Coty’s historical financials…
Coty Has Been Profitable
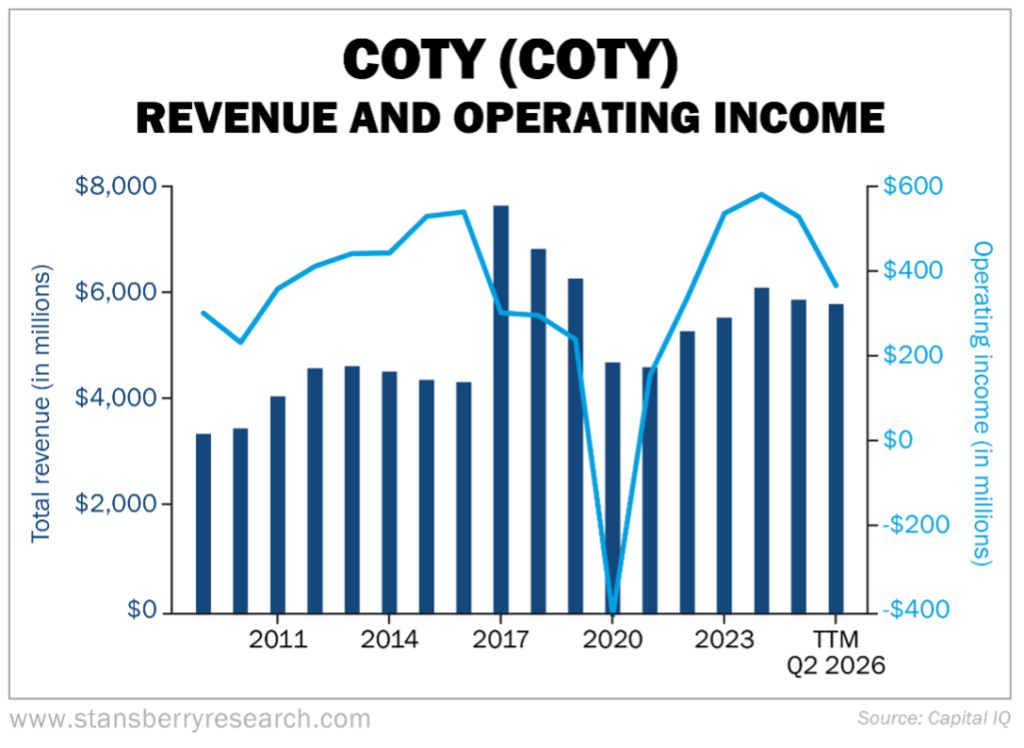
Coming out of the global financial crisis through 2016, operating profit rose steadily while revenues were relatively flat. Then Coty acquired Procter & Gamble’s (PG) perfume, hair care, and makeup businesses for $12.5 billion in late 2016…
This move immediately boosted revenues by 76% in 2017. However, operating profit fell by 44% and continued to decline for the next three years.
As you can see in the chart below, the business recovered after the pandemic, but turned down again the past two years, which tanked the stock:
Turning to the cash-flow statement, Coty has generated positive free cash flow (“FCF”) every year except 2018 and 2020. But as you can see below, it declined from 2023 through 2025:
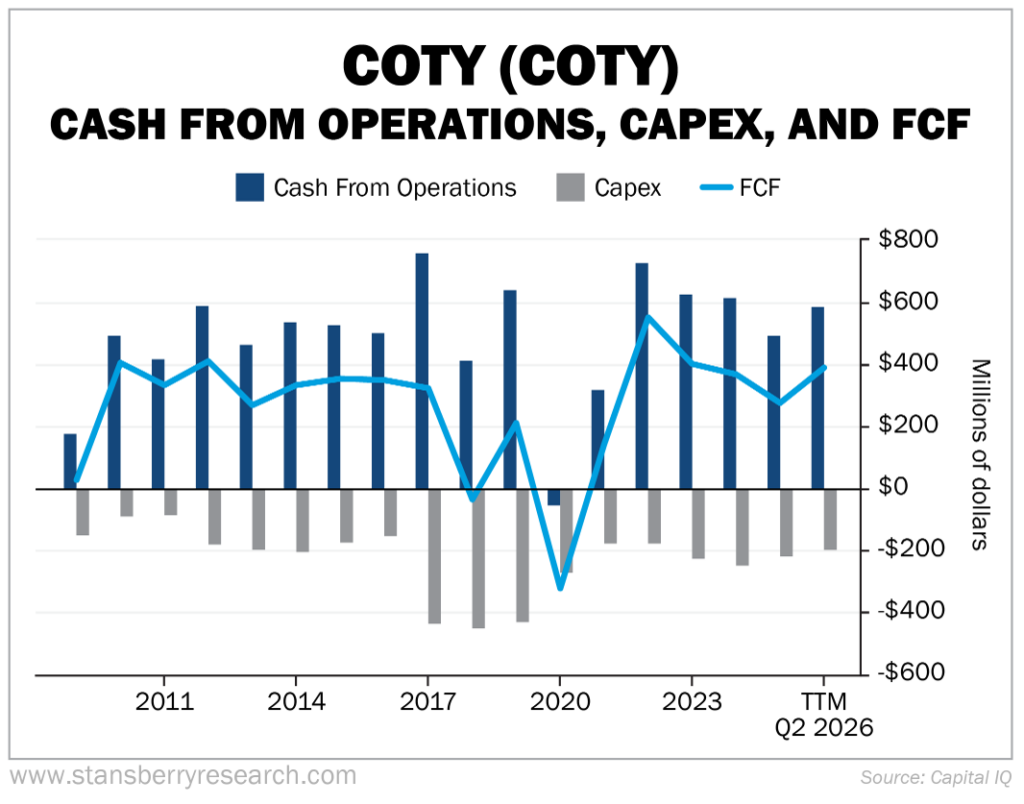
I was heartened to see the uptick over the trailing 12 months (“TTM”)… but also puzzled. Why did operating cash flow jump when operating income declined?
It turns out Coty is taking longer to pay its bills. Let me explain…
Coty Vendors Are Waiting Longer
Every business has a “cash conversion cycle,” which is measured in average days.
It starts with the purchase of inventory, which appears on the balance sheet and is measured in “days inventory outstanding.” This is calculated by dividing inventory by cost of goods sold and multiplying by 365 days.
For Coty, inventory outstanding is around 120 days. That means it takes Coty an average of four months to sell the products it buys.
Then, once Coty sells something, it books “accounts receivable” on the balance sheet until it actually collects the cash from its customers – measured in “days sales outstanding.” For Coty, it’s roughly 40 days.
So, in total, it takes approximately 160 days from when Coty takes possession of inventory to when it sells it and receives the cash.
Offsetting this is how long Coty takes to pay for the inventory it buys – shown on the balance sheet as “accounts payable” and measured in “days payable outstanding.” Coty historically took fewer than 200 days to pay its bills. But this crept up to the 200-to-250 range from 2020 through 2023. (Note that due to CapitalIQ data issues, five quarters of data from 2019 and 2020 is missing from the chart below.) Then, in the past two years, days payable exploded, reaching an all-time high of 320 days in the fourth quarter of 2025
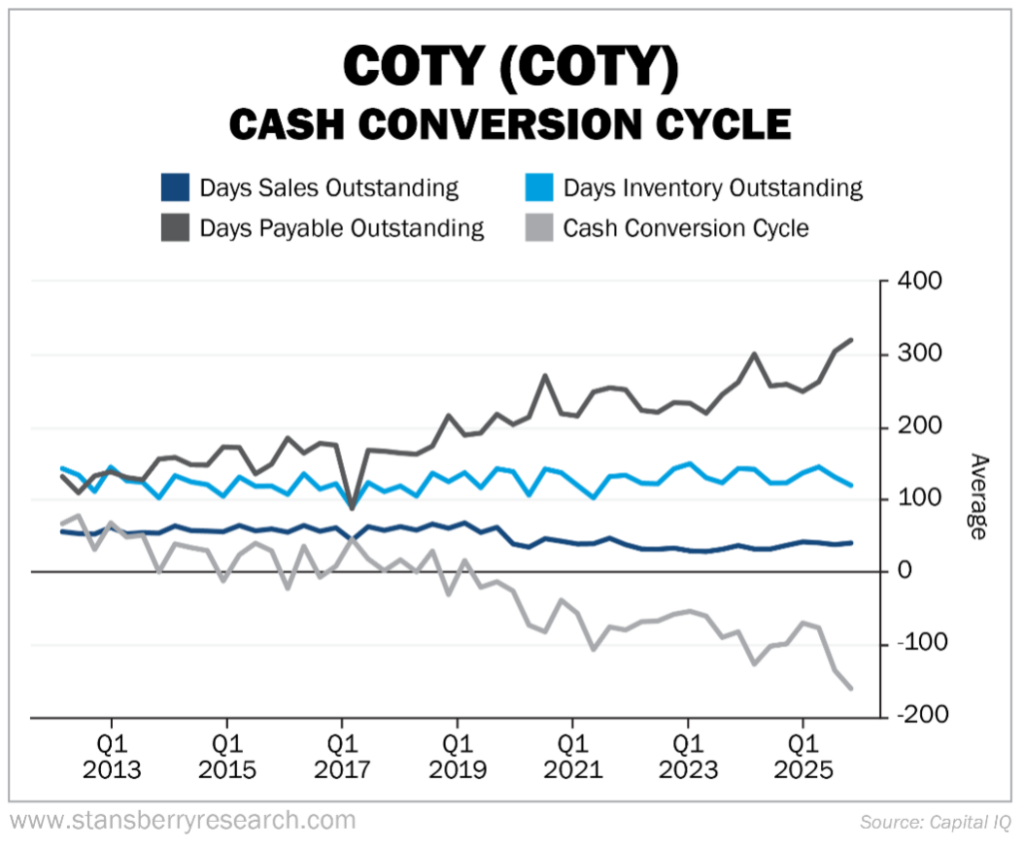
By combining these three numbers – “days inventory” plus “days sales” minus “days payable” – you arrive at the cash conversion cycle.
Generally, a negative number is good. It means that a company sells its inventory and receives cash before it pays its vendors. This indicates it has extra cash in its bank account – and, if it’s steady and sustainable, it’s sort of like insurance float.
The fact that Coty is taking longer to pay its bills means accounts payable is rising, which, dollar for dollar, boosts operating cash flow. But in this case, it smacks of financial distress…
Coty used to pay its bills in around seven months, which is already a long time. But now it’s taking 10.5 months!
I can’t imagine that Coty’s vendors will allow this trend to continue. So I don’t think the recent uptick in FCF will be sustainable.
Let’s now look at Coty’s capital allocation. It has been all over the map…
Selling Its Perfume Business Could Cause Shares to Soar
The company spent $2.2 billion on two large acquisitions in 2011 (truncated in the chart below), then made the aforementioned PG acquisition in 2016. It bought back a large amount of stock from 2014 through 2016 and paid a meaningful dividend from 2017 through 2020:
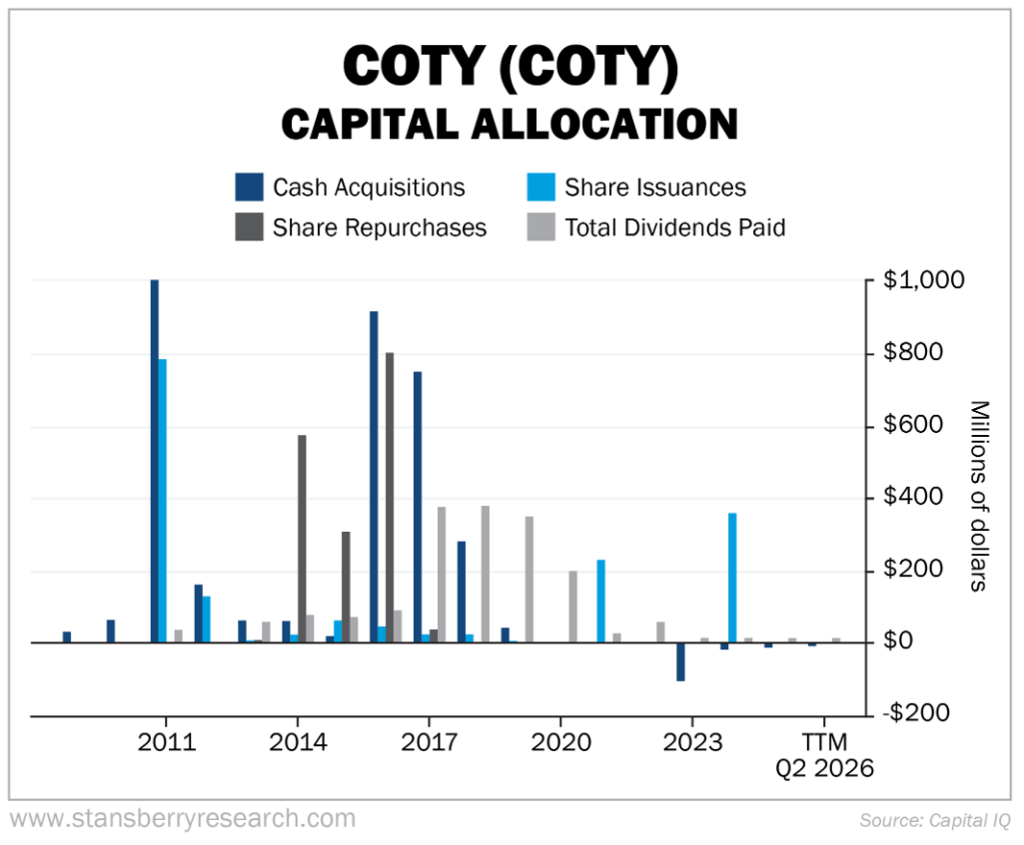
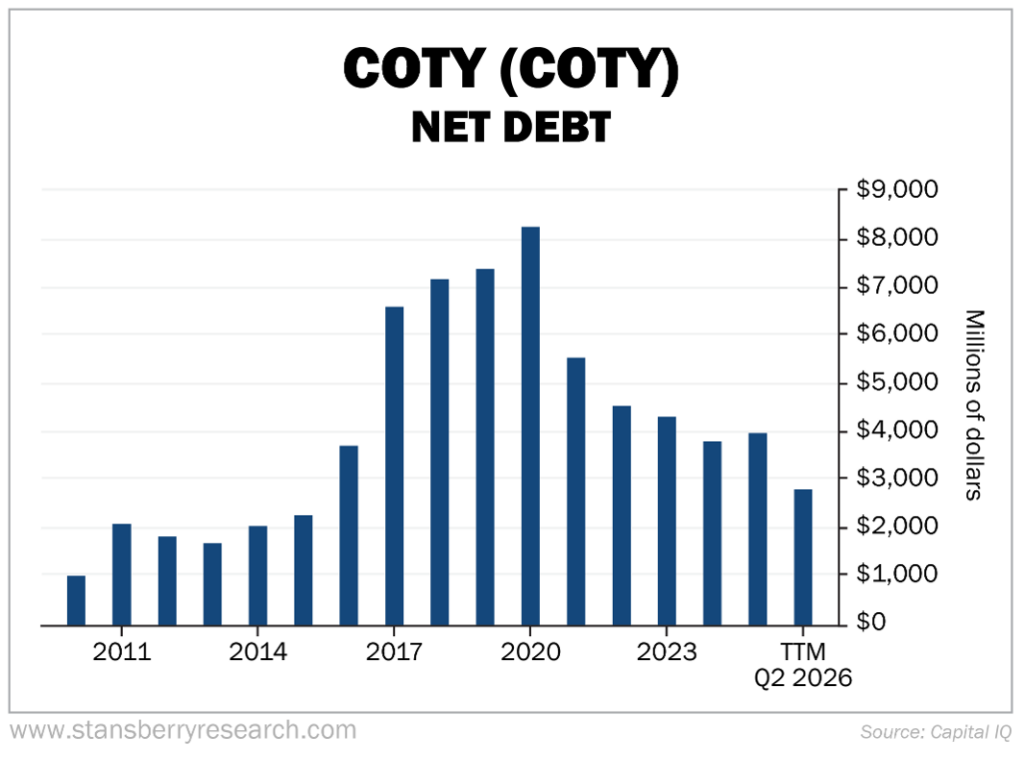
Coty took on a lot of debt to do the PG acquisition, which then continued to rise due to share repurchases, dividends, and negative FCF until it peaked at $8.25 billion in 2020.
Since then, Coty has done two share issuances to raise cash and used its FCF to pay down debt. Today it sits at $2.8 billion, a high but manageable amount if we assume roughly $300 million of FCF for the year:
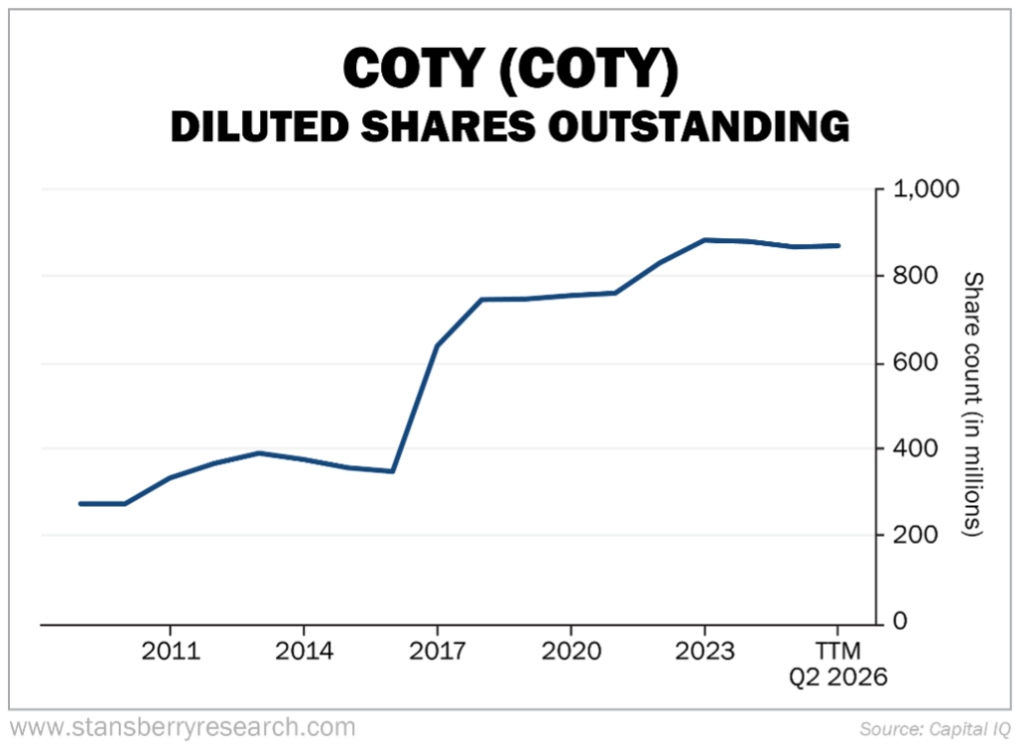
Lastly, Coty’s share count has more than doubled in the past decade, mostly due to the PG acquisition and, to a lesser extent, share issuances:
In summary, Coty’s financials are ugly – hardly surprising in light of what the stock has done. But, frankly, they’re not as ugly as I expected…
The company generates consistent operating profits and FCF, and has paid down two-thirds of its net debt in the past five and a half years.
At yesterday’s closing price of $2.35 per share, Coty has a market capitalization of $2.1 billion. Adding $2.8 billion of net debt, its enterprise value is $4.9 billion. The 17 analysts who follow the company expect earnings this year to be $0.27 per share and $0.37 next year.
So that means the stock is trading at 8.7 times this year’s estimates and 6.4 times next year’s. That looks cheap… But keep in mind that the stock has looked cheap the entire time it has declined by more than 90% over the past decade.
The key to whether this stock works from here is whether the rumor Bradfield heard about the possible sale of Coty’s perfume business is correct.
It sounds plausible to me – I can see how any number of companies would be interested in this asset. And I think his estimate that it could sell for $3.6 billion is roughly correct, which would cause the stock to soar.
I put this stock in the category of “interesting speculation.”
Editor’s Note: This article was adapted from today’s edition of Whitney Tilson’s Daily. Every day, Whitney emails his readers with his comments on the most important topics of the day, including stocks he’s investigating… great articles he has read… his media and podcast appearances. You can sign up here to receive all of Whitney’s daily thoughts and insights.
Recent Articles

KKR, Blackstone, and Brookfield Bet $16 Billion on Kuwait’s Oil Pipeline Deal

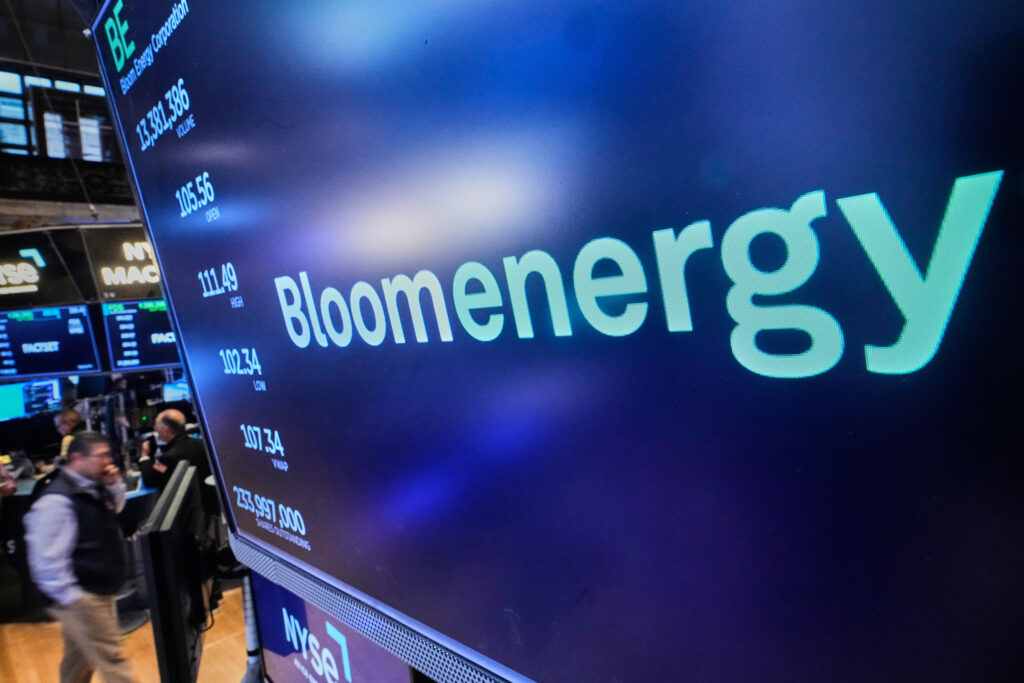
Bloom Energy’s Recent Mega Sell-Off Could Be a Buying Opportunity After a Blowout Earnings Report