Software has had a bruising year. For evidence, just look to the iShares Expanded Tech-Software Sector Fund (IGV). The fund holds a basket of familiar software names – Salesforce (CRM), Intuit (INTU), Adobe (ADBE), among others. And as you can see below, IGV is down approximately 20% year to date.
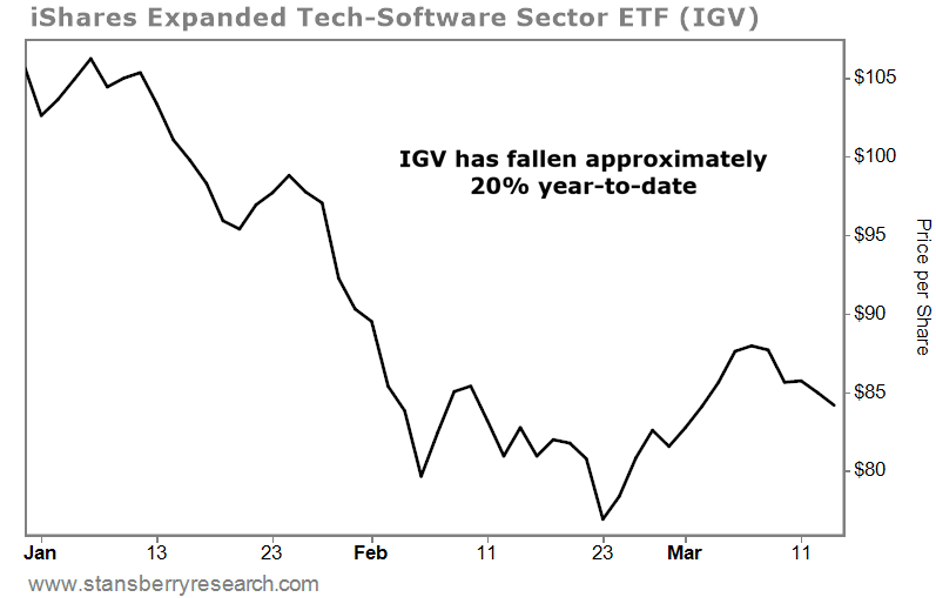
Investors started dumping software stocks in February after artificial intelligence (“AI”) company Anthropic released tools that could theoretically make Software as a Service (“SaaS”) obsolete.
But while the market grew weary of software, retail investors were stepping up in a big way. According to Citadel Securities, February was one of the strongest months for individual (retail) investor buying since 2021.
From Citadel:
To start the year, retail participation has been unprecedented.
Net notional on our platform has reached levels we have never observed before. The magnitude, persistence, and breadth of buying activity have materially exceeded prior peaks, underscoring retail’s role as a primary source of incremental demand in early 2026.
Retail investors appear fully committed to buying big market swoons for one simple reason… doing so over the past decade (between 2015 and 2025) has worked out very well.
Buying the Dip’s Perfect Record (Between 2015 and 2025)
After every abrupt downturn since 2015, stocks recovered relatively quickly. And then they reached new heights.
You probably remember these milestones – the late-2018 dip amid the U.S. trade war with China… the COVID-19-induced panic of 2020… the inflation-fueled decline of 2022… and President Donald Trump’s big tariff announcement last April. You can see this pattern in the S&P 500 Index since 2015…
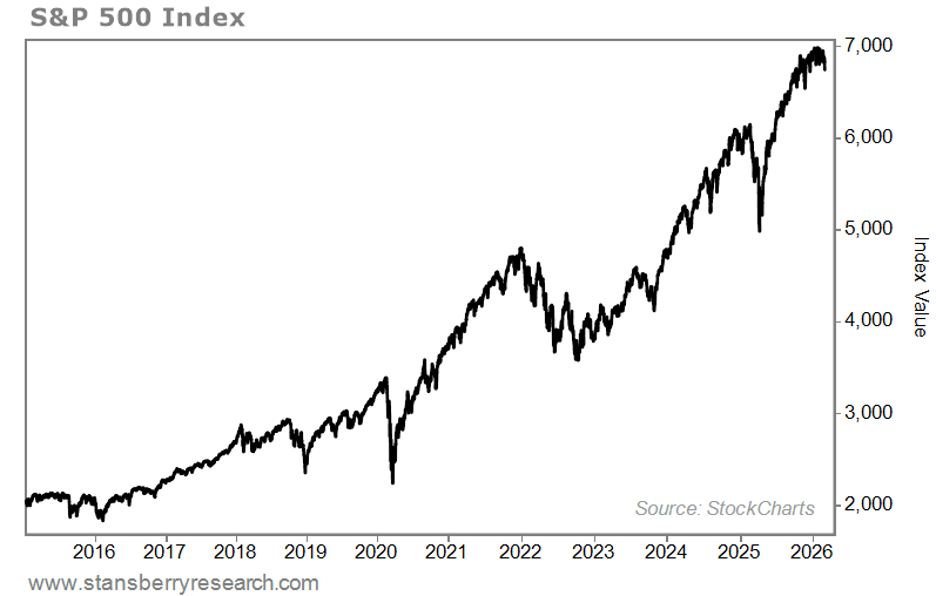
For the past decade, buying the dip has worked… every single time. And based on the record level of volume from retail investors, they seem to be betting it will work once more.
However, individual investors are ignoring a critical historical anomaly that could negatively impact their portfolios.
When you analyze longer time frames, you’ll notice that stocks don’t always bounce back so quickly from fierce sell-offs.
Buying the Dip’s Not-So-Perfect Record (Between 2000 and 2015)
Money manager Scott Fearon, in his excellent book Dead Companies Walking, calls this mistake “historical myopia”…
It’s a classic mistake in business and in life… We assume the recent past is the most accurate predictor of the future and that the more distant past is less important or less relevant… In other words, it’s not that people don’t learn from the past. They do – but only the recent past. And that can be a deadly error.
To understand Fearon’s point, let’s go back a little further, and consider how the S&P 500 performed during the preceding 15-year period (between 2000 and 2015)…
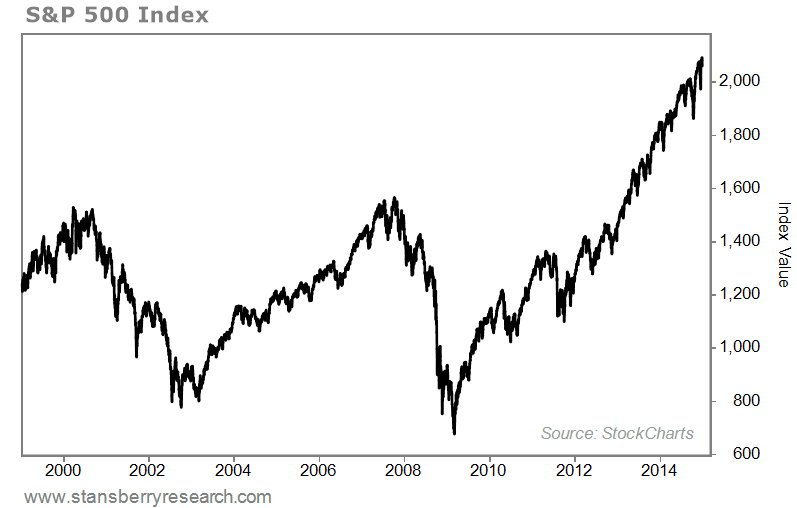
Looking back another 15 years reveals a completely different story…
After reaching an all-time intraday high of 1,553 on March 24, 2000, it took the S&P 500 more than seven years to hit a new all-time high. (It reached 1,576 on October 11, 2007.) After plunging once again, the venerable index took another five and a half years to hit new all-time highs.
The lesson is clear… Don’t assume the stock market will continue to behave as it has since 2015. Doing so could jeopardize your hard-earned gains from the past few years.
Think about it this way… If the next market meltdown takes five to seven years to fully correct – as it did twice between 2000 and 2015 – buying the dips today could keep those positions underwater for many years.
Why 2026 Is Very Different From 2022
The case for buying the dip looks flimsy right now for another reason… In my November 26, 2025 essay, I noted that decades of experience tell me to expect the stock market to make significant lows every 12 months or so, then to bottom out about every four years, like it last did in October 2022. In other words, the market is in the midst of a cyclical downturn that’s likely to last until later in the year, ideally October.
When stocks bottomed four years ago, they also posted their worst year since 2008. The S&P 500 declined 19.4% as the Federal Reserve aggressively raised interest rates to stem raging inflation.
Despite those surging rates (and inflation), the jobs picture remained steady… Unemployment averaged only about 3.6% that year.
The Fed faces a far more difficult situation today… Both inflation and employment are worsening.
Last year (2025), outsourcing firm Challenger, Gray & Christmas reported 1.2 million job cuts and plans to fill 507,647 new positions, or about two jobs lost for each one added. This means the number of jobs being lost in the U.S. economy, relative to those being gained, is accelerating.
On March 5, Challenger announced 156,742 job cuts for the first two months of the year but only 18,061 new hires. That’s nearly nine jobs lost for each job added.
The very next day, the Bureau of Labor Statistics (“BLS”) reported that nonfarm payrolls declined by 92,000 in February. (FactSet had forecasted a gain of 55,000.) The unemployment rate also ticked higher, from 4.3% to 4.4%.
Additionally, the BLS revised December 2025 payroll numbers from 48,000 to negative 17,000, and January payrolls from 130,000 to 126,000. Combined, December and January payrolls fell by 69,000.
In short, the already-weak U.S. labor market is getting weaker. Remember, when consumers are afraid of losing their jobs, they rein in their spending, a key driver of economic activity, and an important catalyst for stocks.
Meanwhile, the war with Iran (launched on February 28) is poised to catapult inflation.
On March 6, President Trump announced (on the Truth Social platform) that he’ll accept nothing less than an unconditional surrender from Iran.
Yet Iran shows no such inclination. The continuous fighting has reduced shipping through the Strait of Hormuz to a standstill. This narrow body of water is the only way for ships to access the Middle Eastern Persian Gulf States. Take a look…

As a result, this conflict is removing some 7 million to 11 million barrels of oil per day – about one-fifth of the global market supply.
With supply plunging, oil prices are soaring… On February 27, light crude oil closed near $67 per barrel. Yesterday, it closed at $97 per barrel. As I write, WTI crude trades around $95.
Qatar’s Energy Minister Saad al-Kaabi estimates that oil could reach $150 per barrel if the war continues for several weeks. Should that happen, expect to pay about $5 per gallon at the pump (and maybe even more).
The bottom line is, the Fed must contend with worsening inflation and employment this time. That’s a sharp contrast to the cyclical downturn in 2022, where the focus was almost exclusively on soaring inflation.
With the added problem of employment, the decline we expect for stocks in 2026 could eclipse the 19.4% plunge we saw in 2022.
Capital Economics Chief Economist Neil Shearing says that if oil prices persist near $100 per barrel, headline inflation could surge 70 basis points. That would make it difficult for the Fed to cut the fed-funds rate, as it has done historically to support the labor market.
We agree with Shearing, and stand by the prediction we first made in Select Value Opportunities on February 11…
Outgoing Fed Chair Jerome Powell will resist changing monetary policy, regardless of the worsening outlook for employment and inflation. He’ll likely leave any decisions to presumptive incoming chair Kevin Warsh, who should lead his first meeting on June 16.
Our 2026 Playbook
Our view is that the potential for a 1-2-3 top formation, which we first alerted our readers to back in November, remains high. Here’s a reminder of what we’re watching for…
Investors shift from buying to selling, causing stocks to fall from an all-time high. (See Point 1 below.) Next, stocks find an intermediate bottom (marked with Point 2). Stocks then bounce and re-test the high (Point 1).
If they fail to make a new high (Point 3) and decline below Point 2, a major market reversal is likely underway. Take a look…
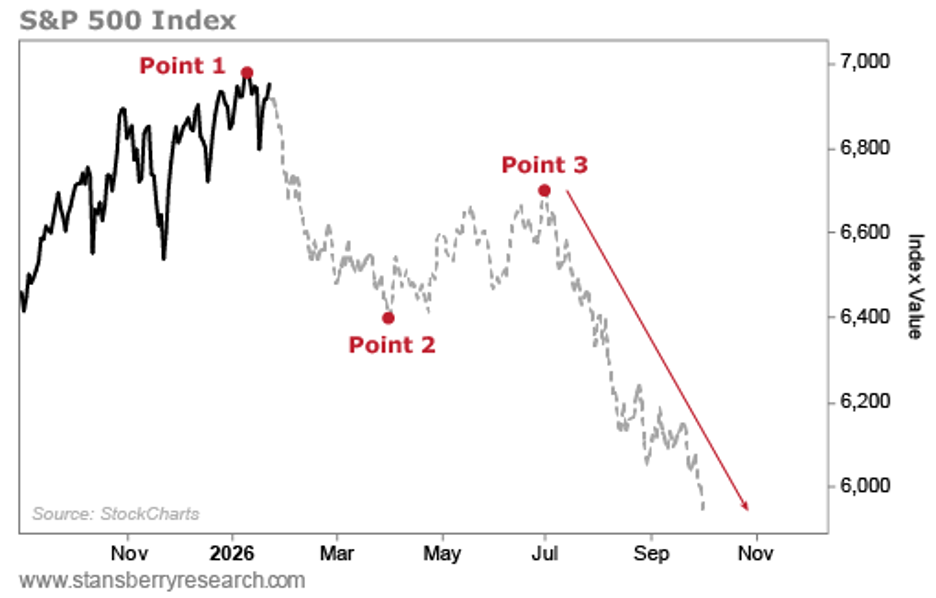
Point 1 is now in place… the S&P 500 hit its all-time high of 7,002 on January 28. Since then, the key index has moved lower, toward an intermediate bottom (Point 2), which we expect to occur this month or next.
The market should bounce back over the summer and resume a downward push into October, marking the anticipated four-year low.
In summary, no stock-buying strategy works 100% of the time, including buying the dip. Never forget that. With employment weak and getting weaker, and inflation poised to soar due to the war in Iran, better buying opportunities are likely to present themselves later this year. In the meantime, prepare to make tough portfolio decisions should stocks continue lower, like selling profitable positions before they go underwater.
Good investing,
Mike Barrett
Editor’s Note: What should you invest in right now?
A renowned former hedge fund founder and his research team have found what they believe is the next big tech trend that could make investors rich.
It’s a breakthrough they’re calling “Helios” – and if you haven’t yet heard of it, you soon will.
Over the next few years, it could impact the food you eat… the water you drink… the places you live and work… and even the prices you pay for airfare, gas, electricity, and household goods.
“Helios” is going to cause a lot of people to lose money, too. Dozens of well-known businesses could go bankrupt.
But if you own a stake in this new tech, the positive effects will far outweigh the negatives. Get the facts for yourself. Make sure you’re not on the wrong side of this trend. Click here to see this new analysis…