
Key Takeaways
- Clean-break CEO handoffs beat the market 83% of the time over three days, versus just 39% when the outgoing CEO stayed on as chair, advisor, or board member.
- When outgoing CEOs stay on as chair, as Tim Cook did at Apple, stocks drop an average of 0.5% over three days and beat the market just 42% of the time.
- Forced CEO exits beat the market 69% of the time over three days and gained 8% over three months, more than double what planned CEO retirements delivered.
- The issue of an Insider vs. outsider successor barely moved the stock, producing a return gap of just half a percentage point.
- Small-cap CEO handoffs beat the market 75% of the time over three months with average gains of 13%, while large-cap handoffs lost 1%.
Clean Break or Continuing Role Makes the Difference
When a CEO steps down, everyone focuses on who’s coming in. But the data suggests one of the biggest factors moving markets is how cleanly the old CEO walks out the door.
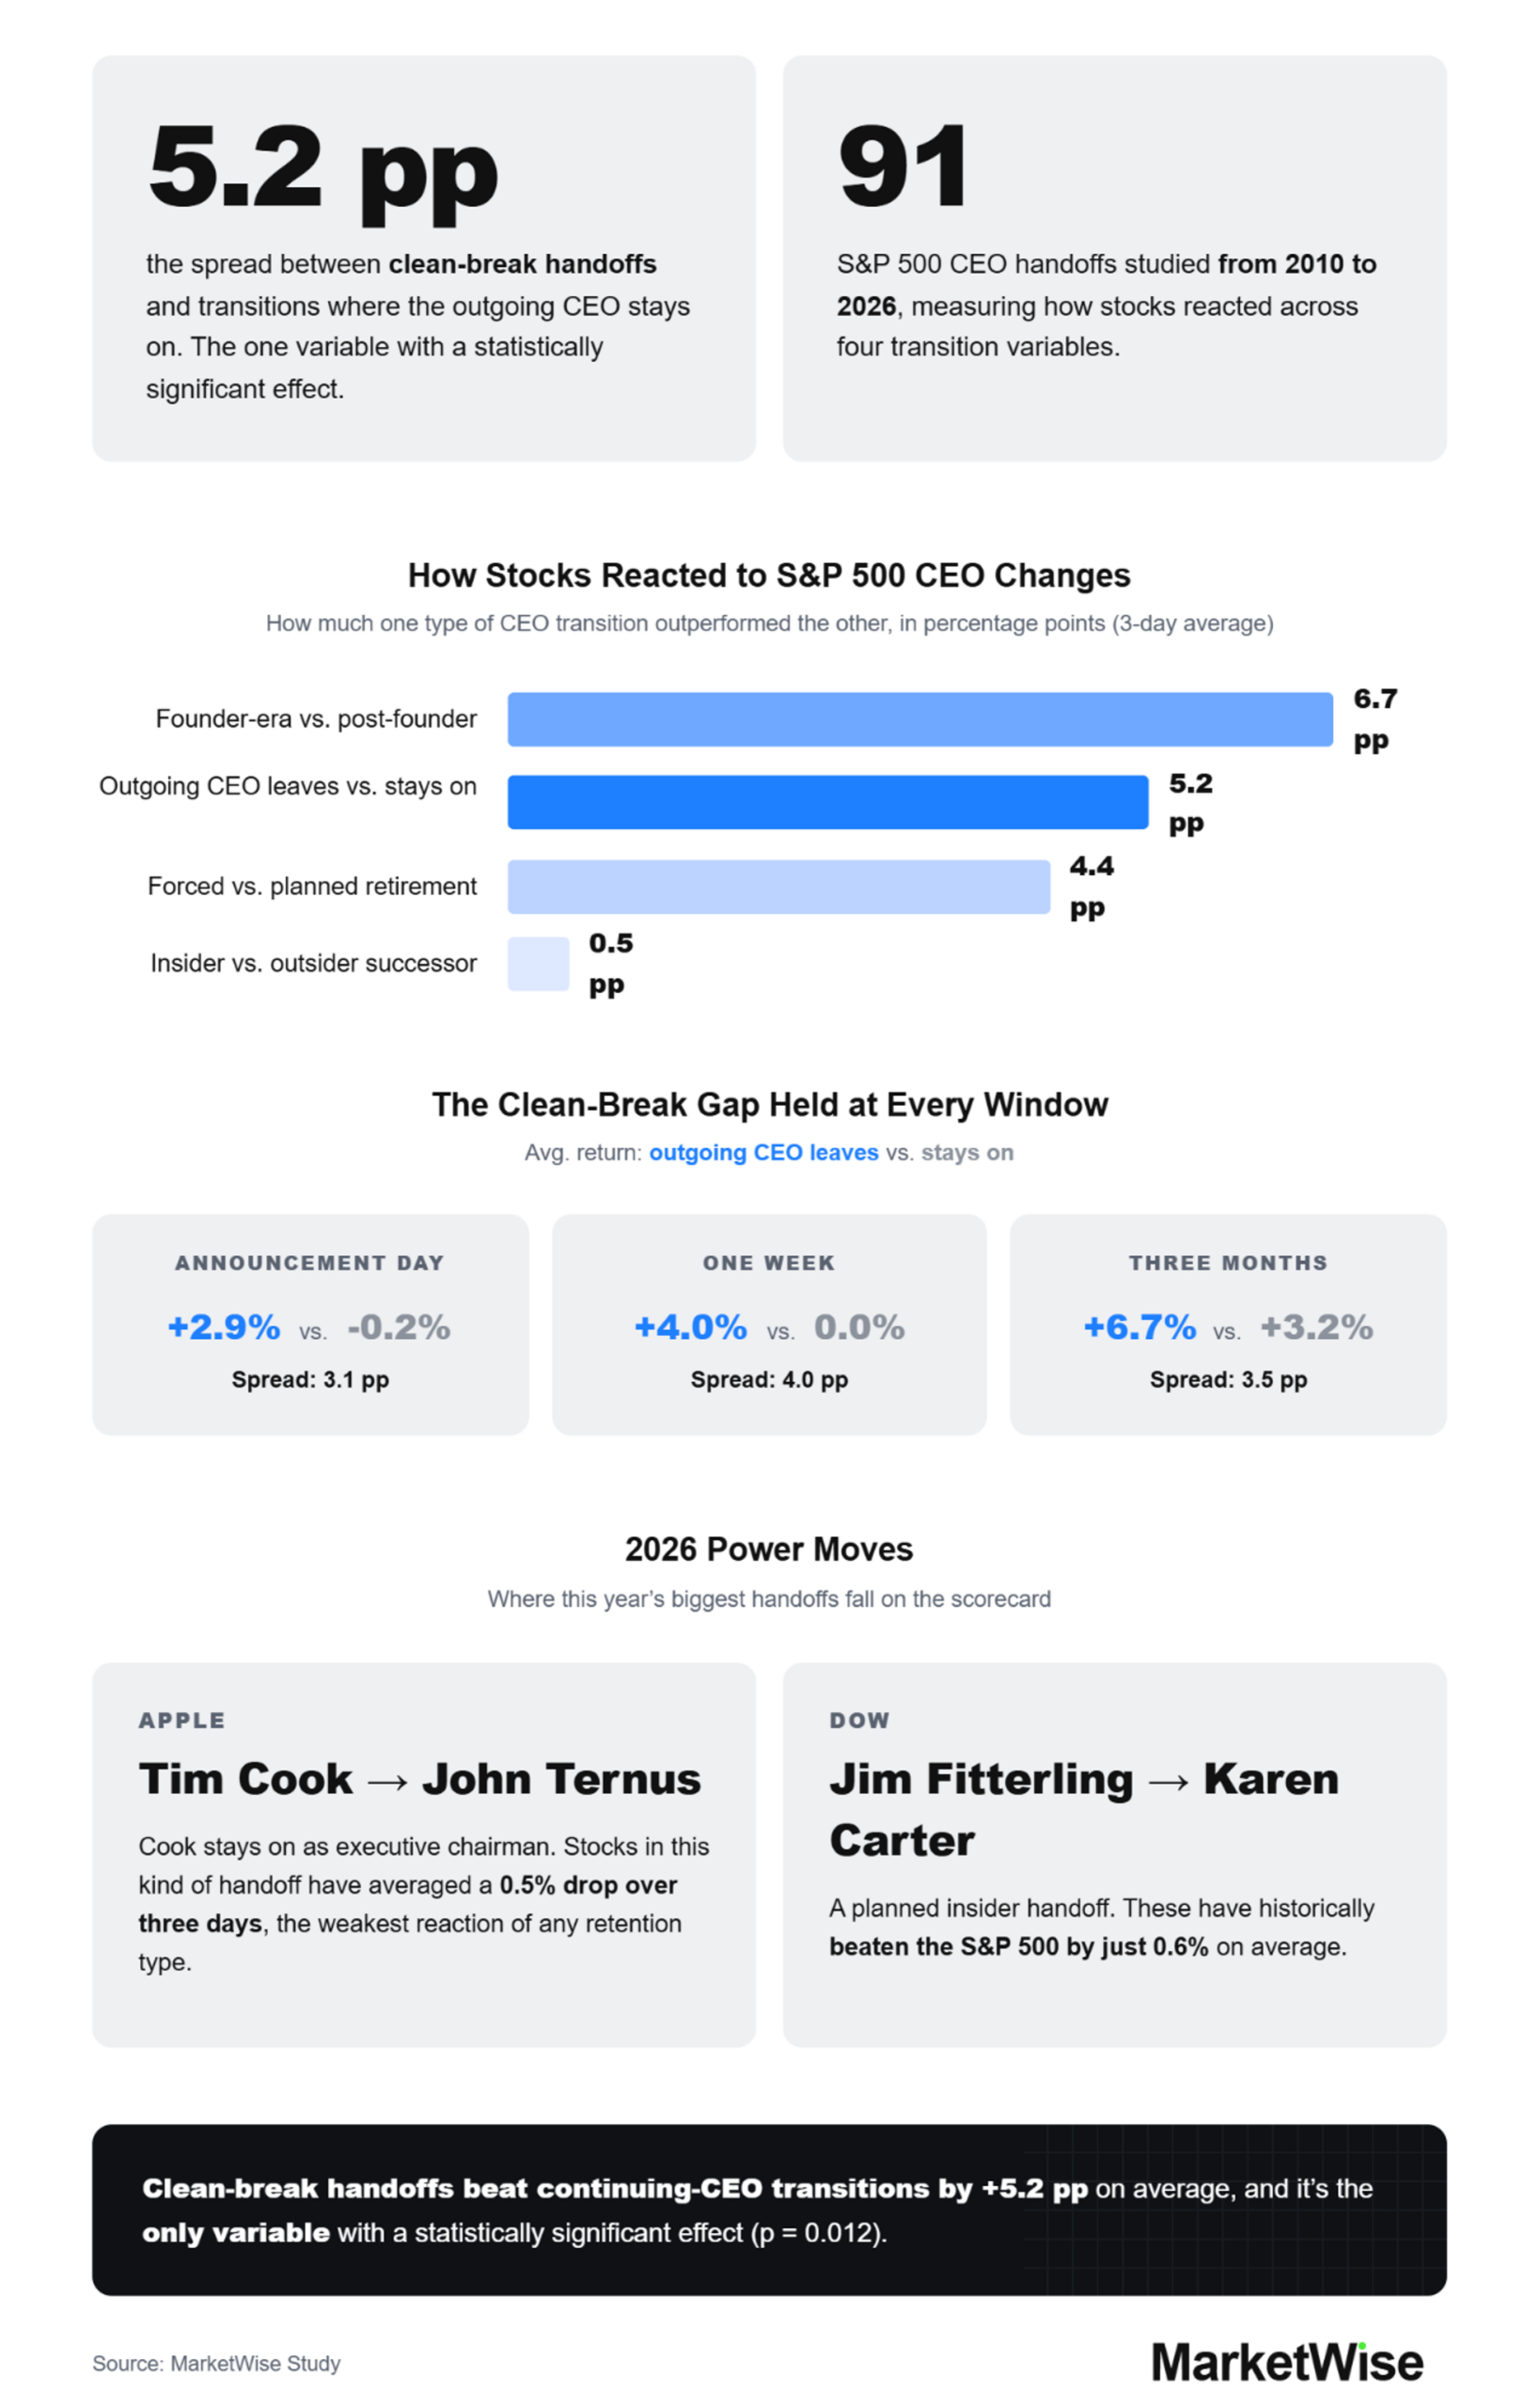
- When the outgoing CEO cuts ties completely, the stock gains an average of 2.9% on the day of the announcement. When they stick around in any role, the stock loses 0.2%.
- Two out of three clean-break announcements (67%) close higher the day of the news. Only one in three handoffs where the old CEO stays on did the same.
- Over three months, clean-break handoffs gained 6.7% on average, more than double the 3.2% return when the old CEO kept a role.
- Outgoing CEOs who stay on as advisors have the worst record. Their companies’ stocks lose money at every point measured, from -1% on day one to -3% three months later.
- Forced CEO exits gain 2.6% on average the day of the announcement. Planned retirements? Just 0.1%. Forced exits keep winning all the way out to three months, when they’d gain 7.6% on average.
- Founder-era CEO deliver the biggest gains of all. When the founder or someone from the founding era steps down, the stock gains an average of 7.7% over three days and 8.1% over three months. That’s about six times what normal handoffs deliver.
- The top three CEO change scenarios are ranked by three-day returns: founder-era (+7.7%), clean break (+4.4%), and getting fired (+4.2%). The worst three: old CEO stays as advisor (-1.9%), stays on the board (-1.3%), or stays as chair (-0.5%).
Smaller Companies Saw the Biggest CEO-Change Moves
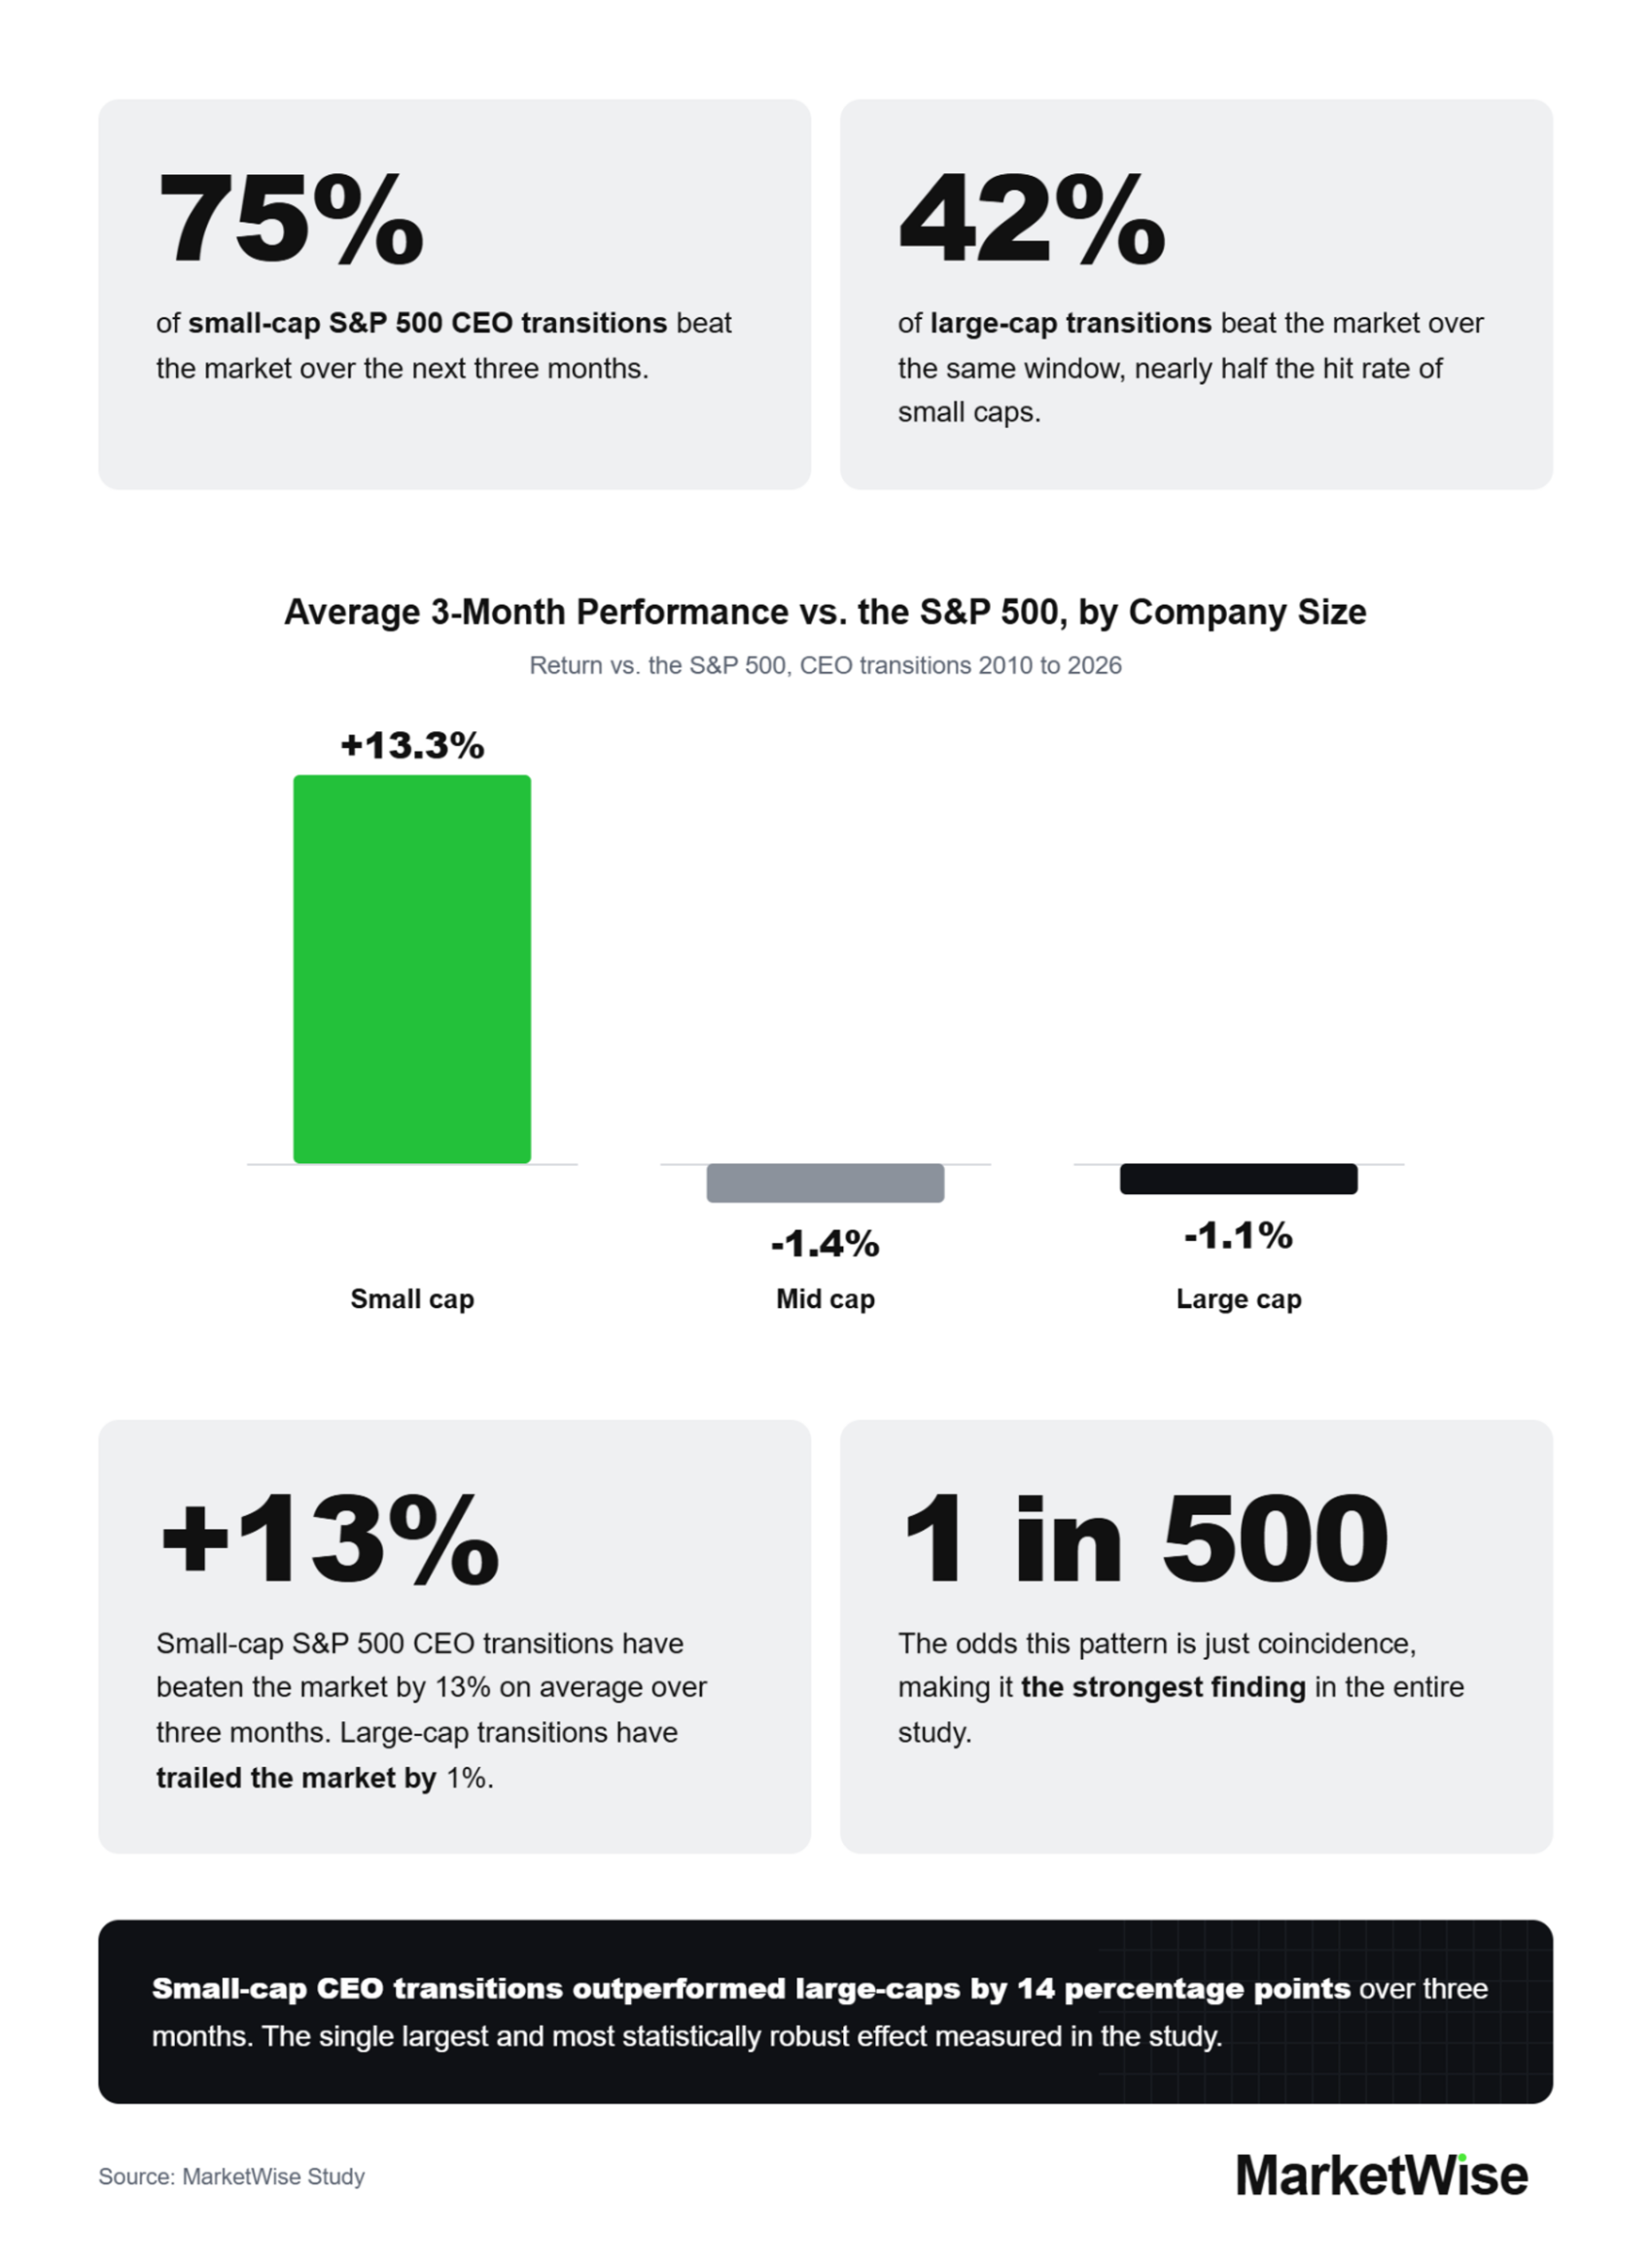
- Over one month, small-cap stocks gain an average of 5% when their CEO changes. Large-cap stocks lose 1.5%. Mid-cap stocks lose 2.9%.
- Nearly 4 out of 5 small-cap CEO handoffs (79%) beat the market over three days. Only 37% of large-cap handoffs did the same.
- Large-cap CEO handoffs lose money on average at every point measured, from day one all the way out to three months.
- The typical small-cap CEO change gains 9.8% over three months. The typical large-cap change loses 1.4%.
- The gap between small-cap and large-cap three-month returns hit 14 percentage points. That’s the widest gap of any comparison in the study.
What the Data Says About CEO Succession and Stocks
Most business coverage treats CEO changes like a big deal. A lot of the time, they aren’t. The question that dominates succession headlines is who’s taking over: insider or outsider. That turns out to be almost meaningless in terms of the stock’s near-term returns. The gap between insider and outsider successors was half a percentage point. What actually correlates the stock is whether the outgoing CEO clears out.
If an outgoing CEO stays on as chair, advisor, or board member, the stock tends to slip. If they leave completely, it tends to rally. Apple’s Tim Cook is the textbook example of the first kind. The stock’s muted reaction to his handoff wasn’t a surprise. It was exactly what 36 other chair-retention handoffs have looked like since 2010. When the next CEO change hits the news, don’t ask who’s taking over. Ask whether the person leaving is actually leaving.
Methodology
What was studied
Whether specific features of a CEO transition (insider vs. outsider successor, planned vs. forced departure, founder-era vs. post-founder handoff, and whether the outgoing CEO retained a role) predictably shape the short-term stock reaction.
Sample
We studied 91 confirmed CEO transitions announced between January 1, 2010, and March 31, 2026, atU.S. public companies. The universe is every company that was in the S&P 500 on January 1, 2026, plus every company added to or removed from the index at any point during the study window, for 825 companies in total. Including removed and acquired names prevents bias toward surviving large-caps.
Event identification
All 27,334 8-K filings with Item 5.02 (“Departure of Directors or Certain Officers…”) for companies in the universe were pulled directly from SEC EDGAR. They were screened to those that explicitly reference a Chief Executive Officer and a transition verb (resign, retire, succeed, appoint, step down, etc.), deduplicated within 90-day windows, capped at three per company, and stratified across years by sector. The resulting 300-filing shortlist was hand-reviewed against the original 8-K text to confirm each was a real CEO transition and to tag it on the four axes.
Returns
For each transition, the company’s adjusted daily close was compared against the S&P 500 (via SPY) to produce cumulative abnormal returns (CAR), defined as company return minus benchmark return, across five event windows: announcement day, 3-day [t‑1, t+1], 1-week [t‑1, t+5], 1-month [t‑1, t+20], and 3-month [t‑1, t+60]. 8-K filings accepted after 4:00 p.m. ET was assigned the next trading day as t=0.
Statistical tests
One-sample t-tests against zero and Welch’s two-sample t-tests between groups. Results flagged significant at p < 0.05. Findings are reported as usable (N of 30 or more per group), usable with caveat (N of 15 to 29), or directional only (N below 15).
Limitations
Hand-tagging involves judgment on borderline cases such as interim-to-permanent conversions, co-CEO structures, and spinoff-era appointments. Small-N subgroups (founder-era N=9, outsider N=9, forced N=13) are directional and are not presented as statistical findings. Eight transitions lost price data because their tickers have been delisted without ongoing feeds; those events remain in the events table but are excluded from return analyses. “Small-cap” in this study means a roughly $5 to $25 billion market cap, or the bottom third of the S&P 500 sample, not microcap.
Data sources
SEC EDGAR (8-K filings), Wikipedia (S&P 500 historical membership), Yahoo Finance via the yfinance library (adjusted daily closes and SPY benchmark), and the NYSE trading calendar.
About MarketWise
MarketWise is a leading financial research and education platform serving self-directed investors. Through a network of independent brands, including Stansberry Research, Altimetry, Chaikin Analytics, TradeSmith, InvestorPlace, Brownstone Research, and Wide Moat Research, MarketWise delivers independent insights, tools, and software to help individuals navigate complex markets with confidence. Whether you’re exploring emerging opportunities or seeking stability, MarketWise supports every investor with credible research and actionable strategies.
Fair Use Statement
We welcome the use of this study for noncommercial purposes. If you share or reference any part of this content, please include a link back to this page to credit MarketWise appropriately.