Every investor loves a good “what if” scenario. What if you had put $10,000 into the right asset at the right time back in early 2021?
To answer that, MarketWise analyzed 21 wildly different assets, from cryptocurrency and stocks to sneakers and Pokémon cards, tracking their performance from January 2021 through April 2026. The results reveal a market shaped as much by timing and hype as by fundamentals, with outcomes that range from life-changing gains to total losses.
Key Takeaways
- Cryptocurrency Solana turned $10K into $357,628 (+3,476%) in 5 years, starting at just $2.49 in January 2021.
- A sealed Pokémon card box (+1,750%) beat every crypto except Solana, outperforming Dogecoin (+919%), Bitcoin (+141%), and Ethereum (+133%).
- Silver (+190%) beat gold (+145%), Bitcoin (+141%), and the S&P 500 (+107%) from the same January 2021 starting point.
- Three of the most-followed AI and innovation ETFs (ARKK, BOTZ, AIQ) returned just +28% in 5 years, underperforming the S&P 500 (+107%) by 79 percentage points, despite the massive hype surrounding AI.
- A pair of Travis Scott x Fragment Air Jordan 1 sneakers (+916%) nearly matched Dogecoin (+919%), and outperformed Bitcoin, Ethereum, and gold.
- Meme stock outcomes varied wildly from the same $10K start: GameStop (+469%), AMC (-91%), and Bed Bath & Beyond (-100%).
- Dogecoin timing made a $100K difference: January 2021 buyers have $101,920, while May peak buyers have just $1,454.
The Investment Leaderboard

Best vs. Worst Outcomes
Top performer: Solana (+3,476%)
Worst performer: Bed Bath & Beyond (-100%)
- Solana stood alone at the top, turning $10,000 into $357,628. At the other extreme, Bed Bath & Beyond investors were wiped out entirely. That spread captures just how wide outcomes were over the same 5-year window.
Best Unexpected vs. Expected Returns
Sealed Pokémon box: +1,750%
Bitcoin: +141%
- Some of the biggest surprises came from outside traditional markets. Sealed Pokémon products returned +1,750%, beating every major crypto except Solana, including Bitcoin (+141%) and Ethereum (+133%). The strategy required no grading, no card selection, and no expertise, yet still outperformed widely followed assets.
Same Asset, Different Result
Moonbreon (raw): +712%
Moonbreon (PSA 10): +490%
“Moonbreon” refers to the Umbreon VMAX alternate art card from the Evolving Skies Pokémon set, one of the most sought-after modern collectibles during the study period.
- The ungraded (raw) version outperformed the higher-end graded card by a wide margin. A higher entry price worked against the graded buyer, creating a 222 percentage point return gap in favor of the simpler approach.
Vintage vs. Modern Pokémon Cards
Charizard PSA 9: +12%
Shining Fates Charizard: -59%
- Despite sharing the same character and grading concept, the modern version suffered from oversupply while the vintage card held its value.
Hype vs. Reality: Did the Buzziest Investments Deliver?
AI ETFs (ARKK, BOTZ, AIQ avg): +28%
S&P 500 (SPY): +107%
- AI investing was the dominant narrative of the 2021 to 2026 window. Yet a basket of three leading AI and innovation ETFs (ARKK, BOTZ, AIQ) averaged just +28% over five years, while a plain S&P 500 index fund quietly returned +107%. The most-discussed investment theme of the era underperformed the most boring one by 79%.
Extreme Dispersion
GameStop: +469%
AMC: -91%
Bed Bath & Beyond: -100%
- The outcomes on meme stocks (shares that go viral on social media, driving prices far beyond their actual business value) varied wildly. GameStop surged massively while others suffered steep losses or complete wipeouts.
The Access Problem
XRP: +524%
- Not every return was actually achievable. XRP posted a strong return, but most U.S. retail investors could not buy it at the starting point due to exchange delistings tied to a lawsuit with the Securities and Exchange Commission. The headline number doesn’t reflect real-world access.
Timing, Hidden Costs, and the True Return
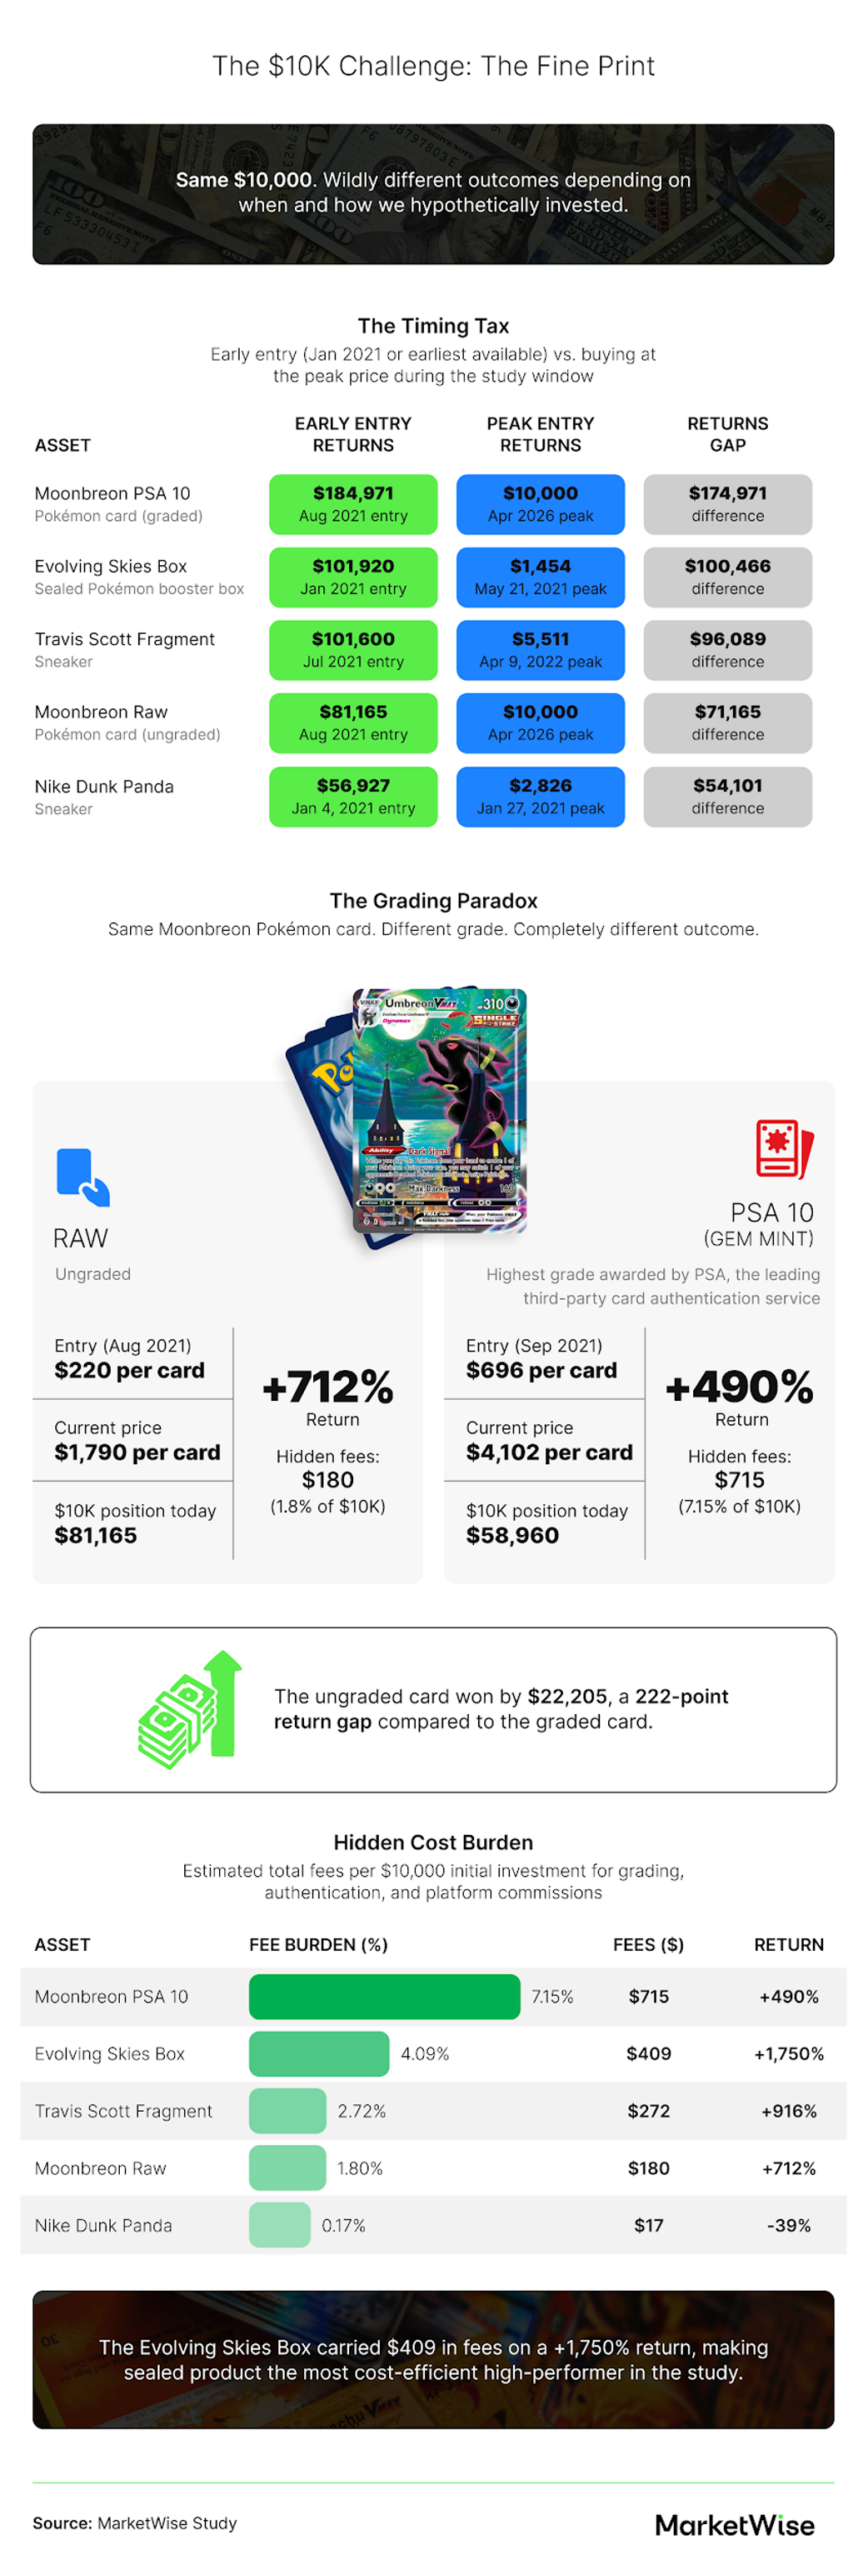
- A Moonbreon card buyer in August 2021paid around $143 at retail, rode the appreciation, and holds $184,971 today. Someone buying the same card now at the current market price is starting at $10,000.
- Travis Scott x Fragment Air Jordan 1 sneakers had the smallest loss of any peak-entry position on a high-appreciation asset in the study. A $10,000 investment at the April 2022 peak price of $3,687 per pair would be worth $5,511 today, a 45% loss.
- GameStop’s timing gap is the meme category’s starkest: A Jan 4 entry totalled $56,927 (+469% return), while a Jan 27 squeeze-peak entry totalled $2,826 (-72%). Just 23 days apart, but a $54,101 difference. This peak marks the height of the Reddit-driven short squeeze, a buying frenzy that briefly sent GameStop to an all-time high before it collapsed.
- Bitcoin’s January 2021 buyers hold $24,123 (+141%), while October 2025 peak buyers hold $6,182 (-38%). Same asset, $17,941 apart.
- The Moonbreon PSA 10 carried $715 in grading and platform fees (7.15% of the initial $10K), the highest cost burden of any asset in the study. It also underperformed compared to its ungraded counterpart by 222 percentage points.
- Nike Dunk Panda sneakers are the only asset where both early and peak buyers finish in the red. Nike’s four restocks in 2022 flooded the market with supply, erasing the scarcity that had driven resale prices up:
- A $10,000 investment at the $115 early price is worth $6,087 (-39%)
- A $10,000 investment at the $306 peak price is worth $2,288 (-77%)
Methodology
A hypothetical $10,000 investment was “made” in each of 21 assets, held from January 4, 2021, through April 2026. All returns are calculated per unit using secondary market or ETF closing prices. No dividends, rebalancing, or dollar-cost averaging applied.
Data Sources
Conventional assets and ETFs via Yahoo Finance. Crypto via CoinGecko daily close. Sneakers via StockX transaction averages. Pokemon cards via PriceCharting historical sales.
Asset Flags
SHIB: January 2021 data unavailable on CoinGecko. May 1, 2021, used as entry at $0.000002.
XRP: SEC lawsuit triggered Coinbase and Kraken delistings in January 2021. The January 4 entry price was inaccessible to most US retail investors. Returns shown using that price but flagged accordingly.
GME: Peak price uses January 27 closing price of $86.88, not the $483 intraday high.
Evolving Skies Box: $10,000 equates to approximately 70 boxes at retail, which is not a realistic single-buyer purchase. The +1,750% return is calculated per unit from the $143.64 retail entry price. Narrative scenarios should scale to 3 to 5 boxes.
AI ETF Composite: ARKK, BOTZ, and AIQ are equal-weighted and averaged to +28% composite. Individual returns are broken out separately.
Moonbreon Raw Entry Price: Two data points were identified for the August 2021 entry price: $175 per card and $220 per card. The $220 figure reflects the more accurate secondary market average from PriceCharting transaction data for that period and is used throughout this study.
Hidden Costs
Fee estimates based on published PSA grading schedules, StockX seller commission rates, and platform fee cards, current as of April 2026. All figures are approximations.
Disclosures
All returns based on secondary market prices. Past performance does not guarantee future results. For informational and editorial purposes only. Not investment advice. MarketWise, April 2026.
About MarketWise
MarketWise is a leading financial research and education platform serving self-directed investors. Through a network of independent brands, including Stansberry Research, Altimetry, Chaikin Analytics, TradeSmith, InvestorPlace, Brownstone Research, and Wide Moat Research, MarketWise delivers independent insights, tools, and software to help individuals navigate complex markets with confidence. Whether you’re exploring emerging opportunities or seeking stability, MarketWise supports every investor with credible research and actionable strategies.
Fair Use Statement
We welcome the use of this study for noncommercial purposes. If you share or reference any part of this content, please include a link back to this page to credit MarketWise appropriately.