Today’s issue in preview:
- Oil stocks flash a rare and bullish signal. Attention should be paid
- AI is killing these former tech stock winners
- Are the good times in copper over? This chart provides the answer
- Our solar trade explodes to a new high… our critical resources trade soars… the quiet boom in U.S. manufacturers continues
Oil stocks flash a rare and bullish signal. Attention should be paid.

Once in a while, the market sends you a signal that you’re doing something right. We recently received one such signal. The market just let us know that owning oil stocks is still a good idea.
On September 29, I highlighted the emerging leadership of oil stocks and covered the bull case for this sector, which can be summed up like this:
If the global economy is growing, oil demand will remain solid. But importantly, U.S. shale oil production growth looks like it is peaking. This would remove a reliable source of production growth that has been in place for over a decade. Plus, oil is very cheap relative to gold and other assets, indicating good value.
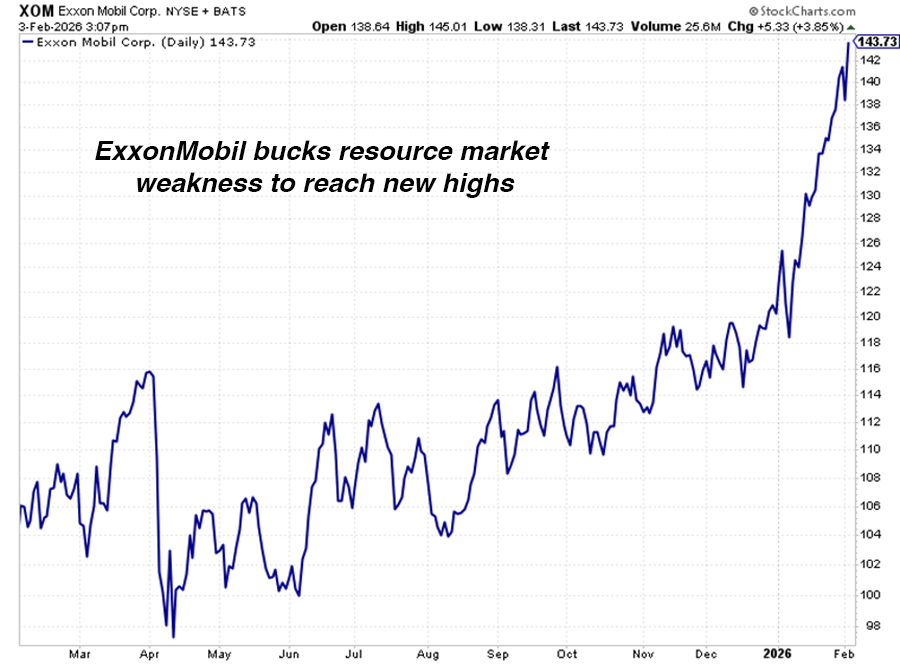
The recommendation was well timed. Since my original note, many oil stocks have climbed to new highs. Oil giant ExxonMobil (XOM) is up 23%. The S&P Oil and Gas Equipment & Services ETF (XES) is up 33%.
This trade recently got a big seal of approval from the market. The oil sector did well during the critical resource market’s recent “stress test.”
Last Friday, the critical resource market was rocked by one of the biggest, broadest selloffs in recent history. Silver dropped 28%. Gold dropped 11%. The gold miner fund we track dropped 12%. The copper miner fund we track dropped 10%. The uranium miner fund we track dropped 7.4%. They were all huge, anomalous moves.
The financial media attributed the shellacking to Asian speculators, changing margin requirements for traders, and the naming of Kevin Warsh as the new Fed Chairman. But really, gold and silver had simply run too far too fast. They were due for a correction. And the correction took down most critical resource markets.
Most, but not all. On the day of the resource market wipeout, two of the big oil-focused ETFs we follow climbed in price. Plus, oil giants ExxonMobil and Chevron (CVX) hit new all-time highs this week.
Critical resource sectors such as gold mining, copper mining, and oil production have their own supply-and-demand dynamics, but they often trade as a herd. On a big down day like last Friday, they all tend to go down.
However, oil stocks held like a rock on Friday. This is bullish price action.
During times of resource market weakness, I like to look for which stocks, ETFs, and themes are holding steady or advancing. It’s a “stress test.”
If the market drops 3%, you want to see what drops just 1%. If the market drops 2%, you want to see what climbs 1%. That sort of thing. This is often called “relative strength.” It allows you to spot the safer megatrends for investment.
It’s like looking at a beachfront neighborhood after a hurricane. Some homes lost their roofs, and some homes were blown away. But some homes were unbothered by the storm. Those are the strongest homes.
Oil stocks have held steady, and some reached new all-time highs during a terrible time for the overall resource market. This tells us the structure underpinning the oil market – the producers, the consumers, the banks and the investors – are aligned in such a manner that provides incredible support for oil stocks. I remain bullish.
Do you realize how much AI threatens your investment portfolio?

Over the past decade, the great American “wealth divide” has become the subject of heated debate. Some Americans are making huge amounts of money in industries such as AI, defense, and health care. Meanwhile, a lot more Americans are struggling financially, and they’re angry.
This is often called the “K-shaped economy.”
Less discussed, however, is the “K-shaped stock market.” Some stocks are doing extraordinarily well. Some are getting killed. The diverging fortunes of various industries are massive.
On February 2, I highlighted one such divergence: Software stocks vs. AI infrastructure stocks. Some AI infrastructure stocks, such as Micron (MU) and Lumentum (LITE), have more than tripled in value over the past year.
Meanwhile, the software sector is in meltdown. The biggest software players are down 33% – 66% over the past year.
AI is driving this divergence. Many investors believe that massive investments in AI infrastructure will allow AI to create software programs much more cheaply than they are being created now.
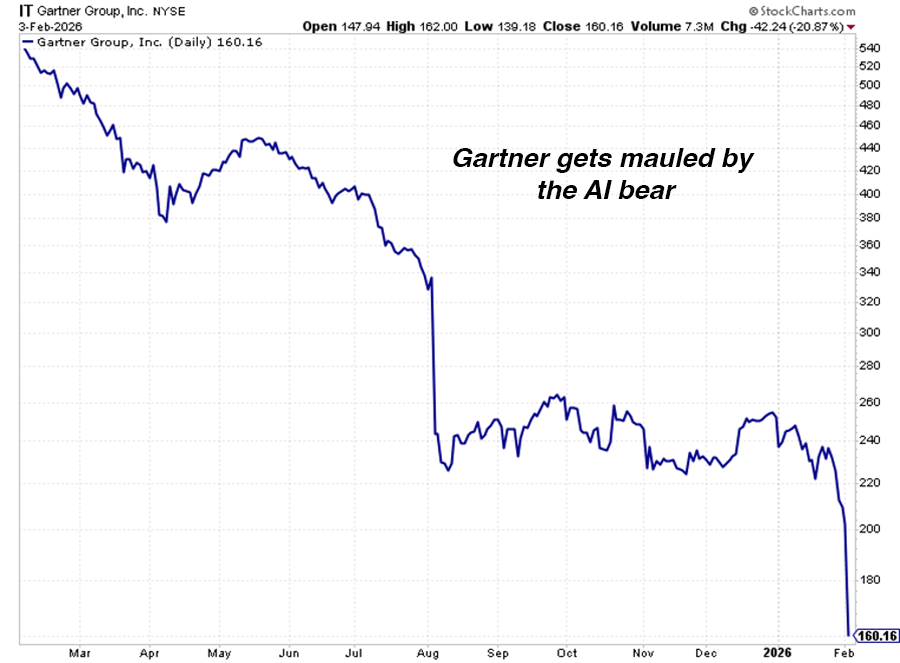
Software isn’t the only industry on the wrong side of AI. This week, the giant technology consulting firm Gartner (IT) plunged 20.8% in one day. The stock is down an incredible 70% over the past year. At one point in Gartner’s bear market, we could have used an old Wall Street saying and remarked that Gartner stock had “split two for one the hard way.”
Gartner’s business is based on charging companies large sums to consult on large technology system purchases. Bears on the stock say AI programs such as ChatGPT and Anthropic’s Claude will provide such consulting for less than 10% of the current price.
Gartner isn’t alone. Shares of big information tools business RELX (RELX) are down 37% over the past year. Shares of legal and tax info business Thomson Reuters (TRI) are down 44% over the past year. Shares of consumer credit info firm Equifax (EFX) are down 34% over the past year.
In other words, if your business is built on collecting data or information, sorting data or information, and analyzing data or information, then AI could prove to be a lethal threat.
The big AI companies could be ferocious new competition. Even upstart competitors using AI will prove to be ferocious new competitors. These new competitors will greatly lower the cost and value of knowledge work and data analytics work. If this is close to describing your current job or one of your portfolio holdings, you should be sweating bullets.
AI will put some of these “knowledge, data, and info” companies out of business. But keep in mind, it doesn’t have to put them out of business to make them stock market losers. AI only needs to lower the cost of producing what they produce over the long run. This will throw a heavy wet blanket on their revenues, growth rates, profit margins, and P/E multiples.
Blazing technological progress isn’t just creating big winners and losers amongst individuals… it’s also doing it in stocks. Stay paranoid.
Are the good times in copper over? This chart provides the answer.
After rising 41% over the past year… and sending related stocks up 145%, is the bull market in copper over?
If you take the long view of this market, it’s unlikely you’ll come to that conclusion.
For more than two years, I’ve been personally long the copper mining theme, and I’ve urged others to go long as well. In a September 25, 2025, note, I highlighted the copper mining sector’s bullish price action and reiterated my call to own it.
The bull case here is simple: Demand from AI, power grid builders, renewable energy, and EVs is turbocharging copper demand. Copper is simply a wonderful conductor of electricity with attractive qualities no other material can currently match. But over the past 20 years, the copper mining industry has discovered or developed few meaningful copper deposits.
That’s the bullish forecast, but regular readers know we care a lot more about what the market thinks of fundamentals than the fundamentals themselves. You can believe in a bullish market forecast until you’re blue in the face, but if that market is moving lower, then your forecast isn’t worth a hell of a lot.
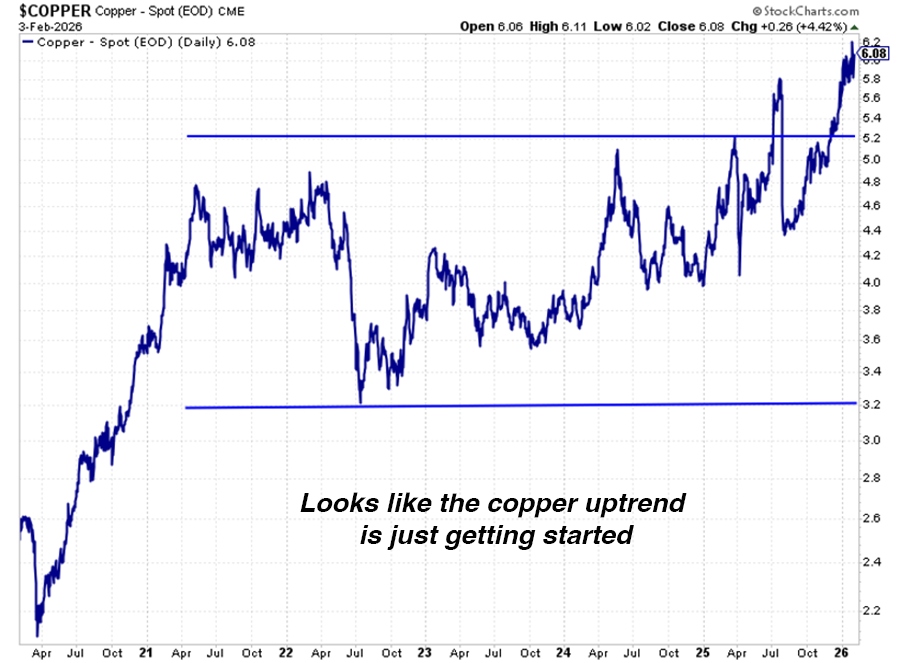
In copper’s case, the market likes the bullish forecast. Copper has advanced 41% over the past year. Last month, it staged a major upside breakout, reaching all-time highs. Copper mining stocks have soared as a result.
After such a strong one-year performance, it’s reasonable to ask if the good times in copper are over. To this, I’ll remind you of something I’ve said many times in M&M: When a critical resource market such as copper trends, that trend tends to last for years.
This is because major shifts in resource supply and demand play out over years, not months. If the world decides it wants a new copper mine, it will not get that mine for a decade. You cannot print or code a copper mine into existence. This means many commodity market trends are glacier-like and play out over 5+ years.
So, let’s keep the “long view” in mind here, which you can see in the 6-year chart below. It shows how copper recently broke out of a multi-year sideways consolidation pattern. This consolidation was four years in the making. The following uptrend will likely last at least as long. It looks like the copper trend is just getting started. I’m still long.
Market Notes
- The solar energy trade I’ve been pounding the table on continues to pay off. Today, the Invesco Solar ETF (TAN) reached a new 1one-year high. It’s up 34% since our original September 2025 note (a 122% annualized rate).
- The AI Power trade we’ve covered many times continues to generate winners. Natural gas power plant turbine maker GE Vernova (GEV) reached a new all-time high this week.
- The huge trend in robust financial liquidity we covered on January 29 continues. Major banks Mizuho Financial (MFG), Barclays (BCS), PNC Bank, (PNC), U.S. Bancorp (USB), and Bank of Montreal (BMO) reached new highs this week.
- The U.S. manufacturing sector continues the huge, under-the-radar boom we’ve been covering. This week, critical-but-relatively-unknown manufacturers Modine Manufacturing (MOD), Woodward Governor (WWD), Preformed Line Products (PLPC), ESCO Technologies (ESE), Gorman-Rupp (GRC), Lincoln Electric (LECO, Valmont (VMC), RBC Bearings (RBC), Flowserve (FLS), Hubbell (HUBB), AMETEK (AME) reached new 52-week highs.
- Our recommendation to own critical resource stocks continues to pay off. Today, mega miners Teck Resources (TECK) and Rio Tinto (RIO) reached new all-time highs.
- The software sector shellacking continues. Large software firms Salesforce (CRM), Adobe (ADBE), ServiceNow (NOW), Workday (WDAY), and Trade Desk (TTD) reached new 52-week lows today.
- High-profile bitcoin proxy stock Strategy (MSTR) reached a new 52-week low today. It’s down 67% over the past six months.
Regards,


Brian Hunt
Editor, Money & Megatrends