It has been easy to get rich in the stock market if you weren’t in a hurry.
All you had to do was keep putting money into your 401(k) and leave it there for decades. Sitting in an S&P 500 index fund, your investment has compounded at nearly 12% per year for the past 20 years. That’s enough to turn $10,000 into nearly $100,000.
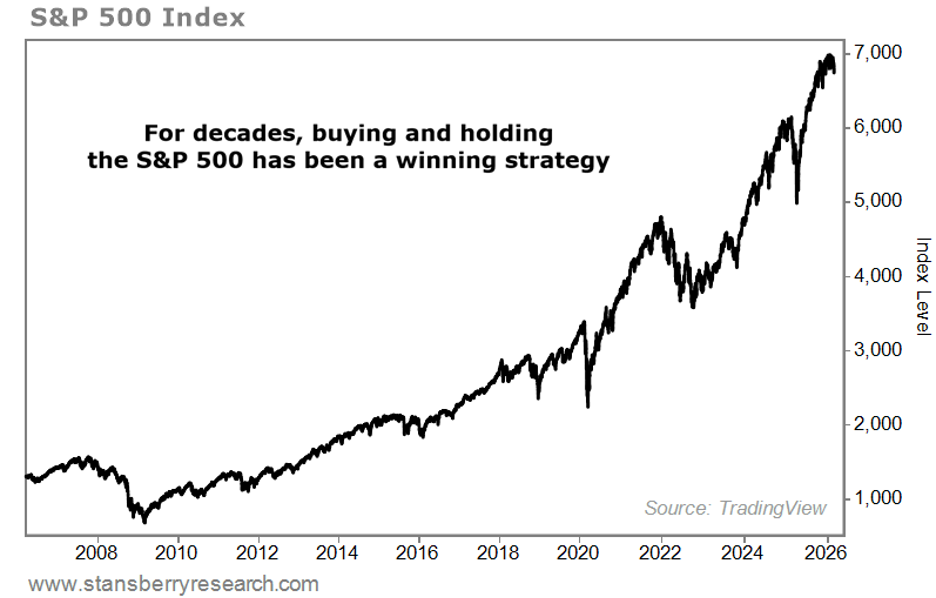
For doing nothing but waiting. And lots of folks are still doing it to this day.
Investors have learned to worship the S&P 500 and not question that it’ll continue delivering astounding returns. Most folks don’t even think about their 401(k). They just automatically contribute and let time do its work.
According to the Investment Company Institute, Americans have nearly $10 trillion socked away in their 401(k) accounts. The most recent data published by Vanguard is taken from five million customer accounts. It indicates that target-date fund assets hit a record $4 trillion in 2024. Target-date funds are heavily weighted toward large-cap U.S. equities – which means they’re heavily weighted toward the S&P 500.
At Vanguard, more than eight in 10 participants used target-date funds, and about two-thirds of all 2024 contributions went into them – more than ever before. Roughly seven in 10 target-date investors had their entire account in a single target-date fund. The fortunes of the American retirement saver and the S&P 500 are one and the same.
But here’s the thing that too few investors know about the index…
The Hidden Problem: Rising Concentration in the S&P 500
The S&P 500 was originally conceived and functioned for many years as a broad, diversified equity index representing the U.S. market. It still represents the U.S. market today, making up nearly 85% of the entire U.S. stock market by market cap.
But the index – and the whole structure of the U.S. stock market – has changed. That’s because the S&P 500 is a market-cap-weighted index. Put more simply, as companies get larger, they take up more of the index’s weighting. And we now live in an age where trillion-dollar-plus market caps are more common. There are nine in the S&P 500 as I write.
As a result, the S&P 500 is no longer the diversified index it was intended to be.
To see what I mean, just look at the top ten S&P 500 stocks as a percentage of the whole index going back more than 30 years.
From 1990 to 2015, the top ten companies of the S&P 500 represented a relatively stable portion of the S&P 500, between 18% and 23%.
All that has changed, with the top 10 S&P 500 companies accounting for nearly 41% of the index’s total weight by the end of 2025 – more than doubling in just 10 years. Investors think they’re buying a diversified index, but they’re putting 41% of their money into just ten names.
Consider how money flows into the index’s various components, and it’ll blow your mind…
According to data compiled by Bloomberg, its largest component is Nvidia (NVDA), with a market cap of $4.32 trillion, and its smallest component is Lamb Weston (LW), at $6.32 billion. Nvidia makes up about 6.7% of the index, and Lamb Weston is roughly 0.01% of it. Nvidia’s share is 675 times the size of Lamb Weston’s. When money flows into the index, $675 goes into Nvidia for every $1 that goes into Lamb Weston.
Those flows seriously distort increases in market value. Simplify Asset Management Strategist Mike Green analyzed how these flows affect the way stock prices move. Cutting to the chase: Flows into the S&P 500 push up the largest component by about three times as much as they push up the smallest component.
That’s an estimate, but even if it’s off by 50%, the effect is still enormous. And it shows you how a cap-weighted index can warp the returns you get from its various components… and ultimately from the overall index.
The point is that the S&P 500 as designed has concentrated assets into the largest components over time – the opposite of its original intent as a broad, diversified portfolio representing the U.S. economy and markets.
And yet, the money flows in, week in, week out, mindlessly, exacerbating the effect on the index and on trillions of dollars of assets invested in it. As I pointed out in my February 27 Stansberry Digest, these same dynamics virtually guarantee that the stock market becomes far more volatile in the coming years. Simply shoving all your money into the index just isn’t as safe as it once was thought to be.
All investors know is that leaving their money in the S&P 500 has worked. Most are likely unaware that 52% of their 2025 return came from just seven stocks: Nvidia, Alphabet (GOOGL), Microsoft (MSFT), Broadcom (AVGO), JPMorgan Chase (JPM), Palantir Technologies (PLTR), and Meta Platforms (META).
According to a report from RBC Wealth Management, it’s even weirder than that:
- 15.5% of your 2025 S&P 500 return was from Nvidia
- 13.5% was from Alphabet
- 23.1% was from Microsoft, Broadcom, JPMorgan Chase, Palantir Technologies, and Meta Platforms
- 47.9% of your 2025 S&P 500 return was from the other 517 stocks (the index had 524 stocks in it during the period, counting all those added/deleted during the year)
Why Market Leadership Always Changes
The top ten stocks don’t stay in the top ten for long, and investors who are unaware can be seriously disappointed by the effect on their returns. With the market more concentrated than ever, investors should expect a change in the top ten stocks’ returns to be more devastating than ever.
In their 2012 paper titled “The Winner’s Curse: Too Big to Succeed?,” authors Rob Arnott and Lillian Wu found:
For investors, Top Dog status – the #1 company, by market capitalization, in each sector or market – is dismayingly unattractive… In an earlier U.S.-only study, we found that 59% of these Top Dogs underperformed their own sector in the next year, and two-thirds lagged their sector over the next decade. We found a daunting magnitude of average underperformance, averaging between 300 and 400 bps per year, over the next 1 to 10 years.
It might not sound sexy, but underperformance of 300 to 400 basis points per year is the difference between compounding at, say, 7% per year compared with 11% per year. Over 10 years, a $10,000 investment growing at 11% becomes $25,582. At 7% it becomes just $18,384 – $7,000 less. That’s huge. If you’re investing $100,000 or $1 million, just add a zero and you get a $70,000 or $700,000 difference over 10 years.
Seemingly small differences have profound implications for the outcome when you’re talking about years of compounding. Exposing yourself to too much of that “Top Dog” effect could be the difference between a great retirement and a ho-hum one.
What Happens When Mega-Cap Stocks Stop Leading
If you want to know what can happen when the regime changes and the top 10 underperform, take a look out the window, because it’s happening right now. The S&P 500 Top Ten Index peaked on October 29 and is down roughly 10% as of March 6, pulling the rest of the index down about 2.5% during the same period. Since the start of the year, the top ten have lost about 4.5% of their value and the market is down about 1.8% (as of Monday, March 9).
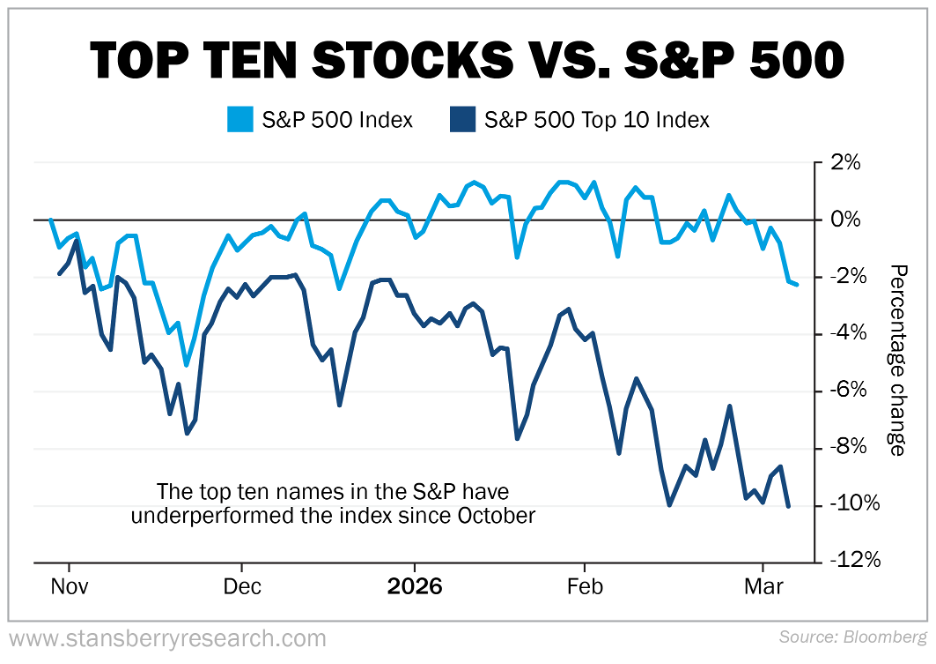
As the chart shows, the overall index can still make new highs even after the top ten stocks peak and begin underperforming. While the top ten peaked in October, the index’s most recent all-time high close was on January 27.
So, it’s not like the S&P 500 will crash and burn with those ten stocks. In fact, it could mean the index may wind up less concentrated… but that’ll take a while. You can take simple actions to protect your retirement portfolio by getting outside the S&P 500, highly concentrated regime right now.
Simply put, you can change strategies without letting the market’s regime change rule your performance.
How Investors Can Diversify Beyond the S&P 500
I can’t make specific recommendations for you here because I don’t know your age, risk tolerance, and whatever other factors that might influence your decision. But I can tell you the kind of moves I’m talking about and give you specific stocks as examples…
For starters, rather than a target date fund or other market-cap-weighted S&P 500 or other index fund, consider using an equal-weighted fund like the Invesco S&P 500 Equal Weight Fund (RSP).
Then you’ll be putting roughly the same amount into the index’s smallest component as you will into its largest.
Besides equal weighting your main equity fund, you should also consider positions in a few alternatives.
For example, in my March 6 Digest, I called energy stocks “The Trade of the Year… Maybe the Decade.” I think you should consider putting an energy exchange-traded fund in your 401(k) to take advantage of the favorable fundamentals. I also like the idea of a position in a diversified portfolio of mining stocks. I believe both mining and energy are the best ways to take advantage of the AI boom.
Energy and materials (which includes mining) sectors make up just 5.6% of the S&P 500, while technology and communications sectors make up 43%. The mega tech stocks, where the index is so concentrated today, fall into the latter two categories, so you might want to beef up your allocation to the much more attractive energy and materials stocks.
An easy way to do that would be to use the State Street Energy Select Sector SPDR Fund (XLE) and the State Street Materials Select Sector SPDR Fund (XLB), which are based on the corresponding S&P 500 sector indexes. I’ve recommended a total of six individual energy stocks in The Ferris Report.
I’ve also recommended alternative assets like managed futures, foreign stocks, and newly issued mortgage-backed securities (which I highly recommend for income investors).
The past two decades rewarded patience and passivity. The next two may reward something different – awareness, diversification, and the willingness to act before the top ten drag you down with them.
If your older siblings or your parents built their retirement by setting it and forgetting it, that’s great for them. But the index they trusted looks nothing like the one you’re buying today. The good news is the fix is simple. You just have to make it.
Good Investing,
Dan Ferris
Editor’s Note: What should you invest in right now?
A renowned former hedge fund founder and his research team have found what they believe is the next big tech trend that could make investors rich.
It’s a breakthrough they’re calling “Helios” – and if you haven’t yet heard of it, you soon will.
Over the next few years, it could impact the food you eat… the water you drink… the places you live and work… and even the prices you pay for airfare, gas, electricity, and household goods.
“Helios” is going to cause a lot of people to lose money, too. Dozens of well-known businesses could go bankrupt.
But if you own a stake in this new tech, the positive effects will far outweigh the negatives. Get the facts for yourself. Make sure you’re not on the wrong side of this trend. Click here to see this new analysis…